10/31/2008

The Week That Went Up

My DOW futures chart shows the low on Monday at 7949 and the high on Friday at 9428. It will be interesting to see what happens at the 34 EMA, around the 9600 level. Of course 10000 will be the real test.

Daily Mini DOW Futures Chart
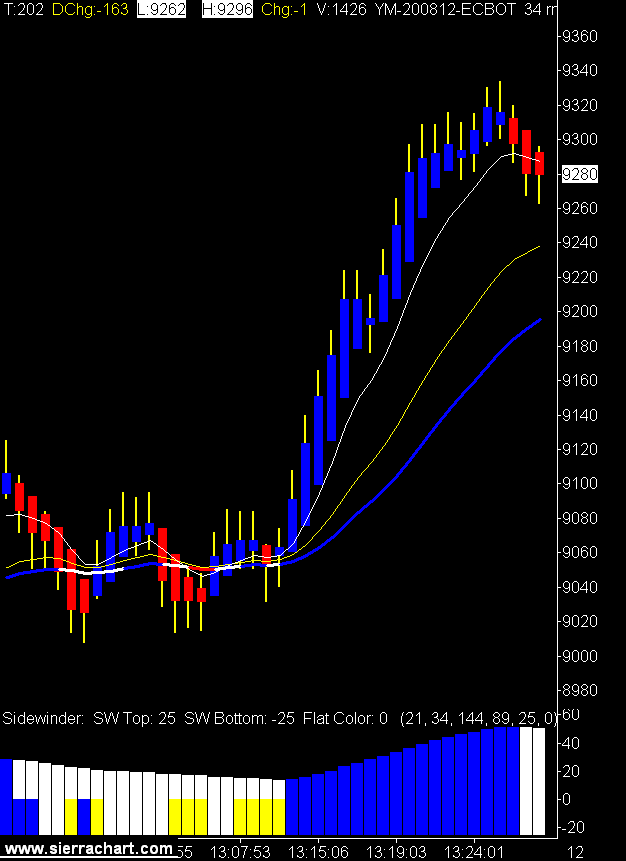
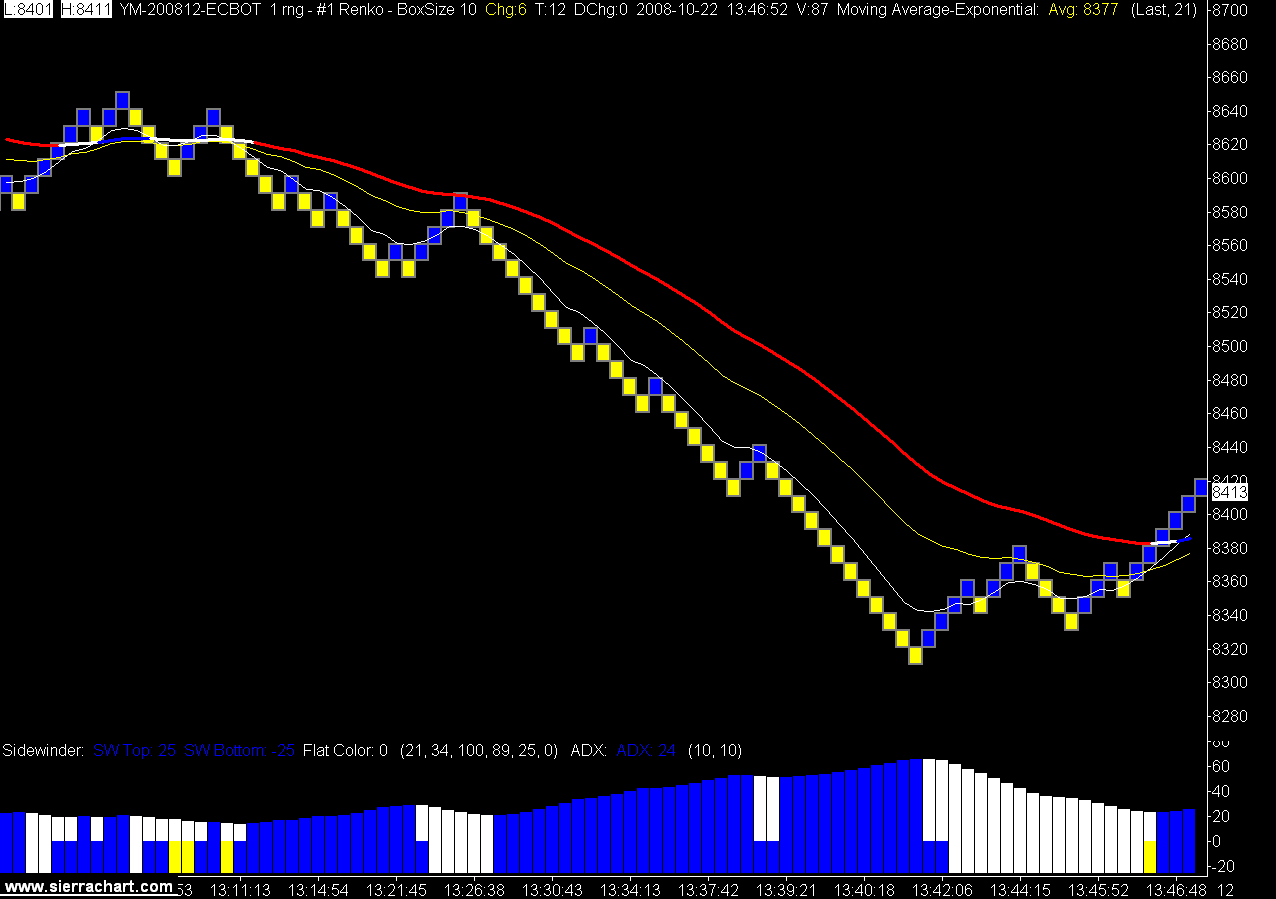
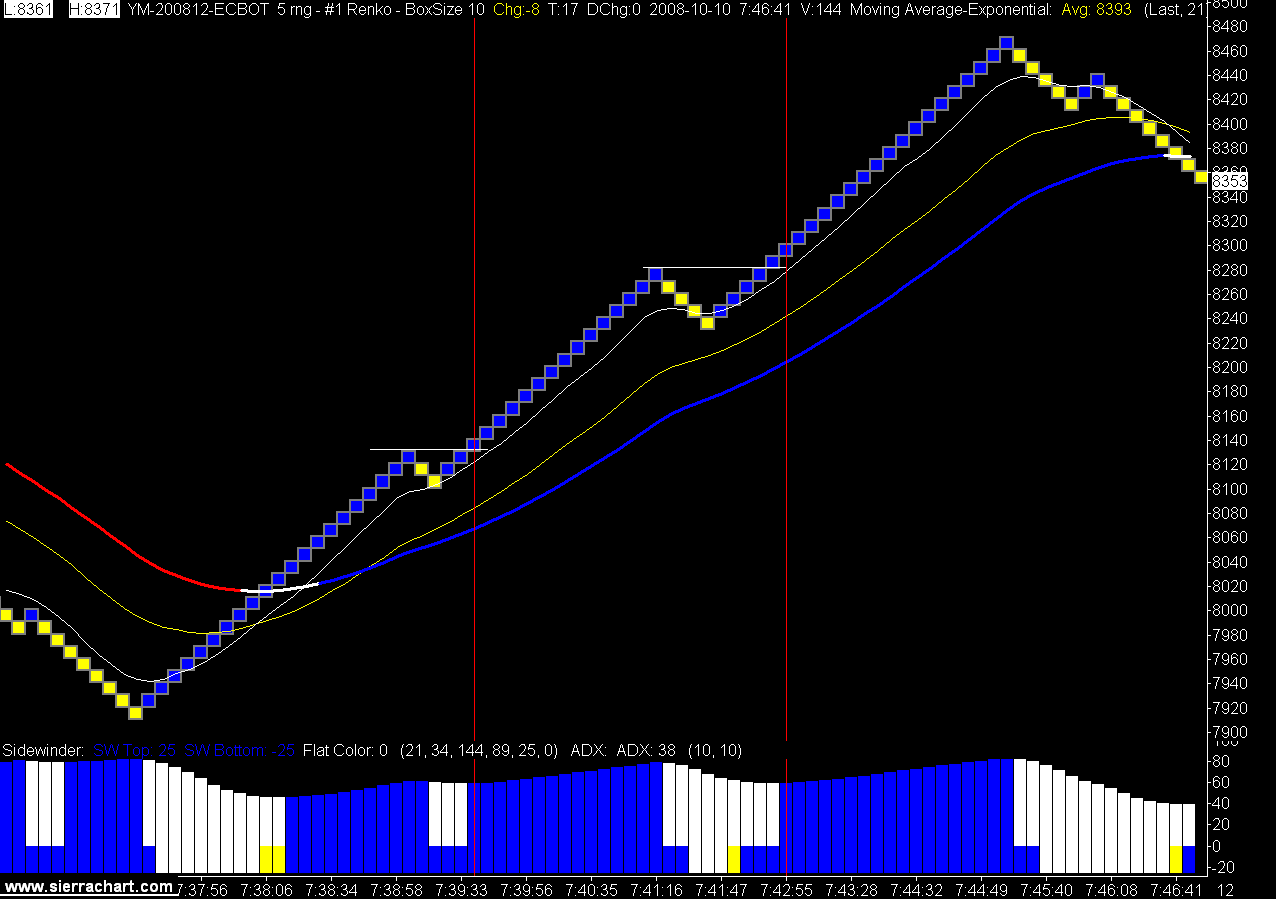
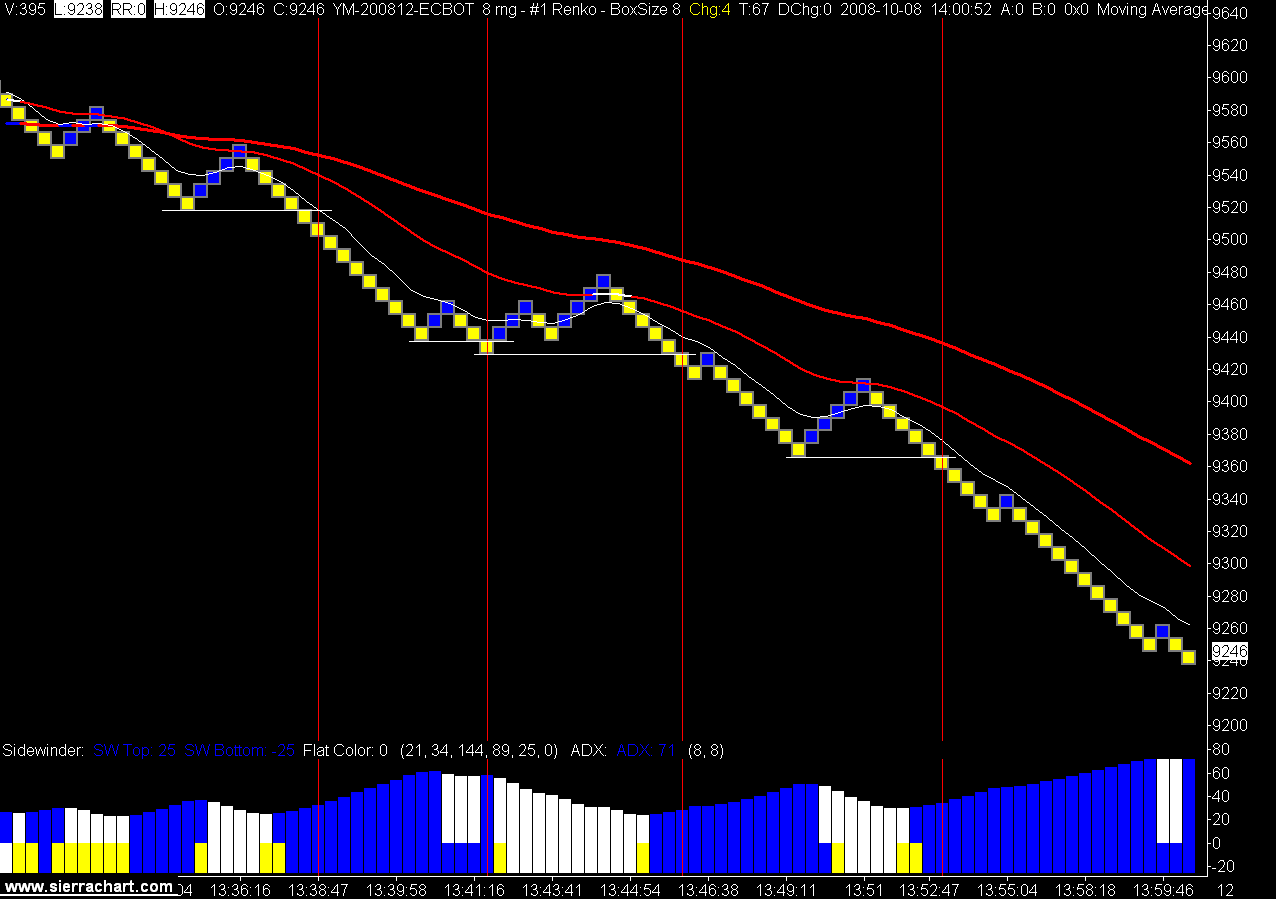
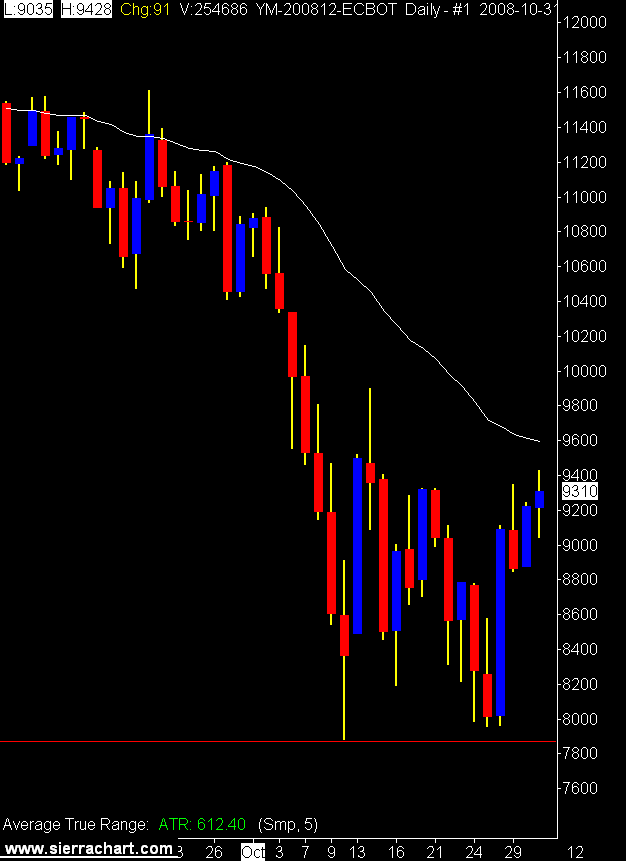
Today's trades, 6 winners, 3 losers, and 4 break evens, for 157 winning tics / 29 losing tics = RR 5.41

Weekly totals
Total Trades 42
Win 40%
Lose 31%
BE 29%
Gross RR 3.16

The key was stopping yesterday after I hit my daily stop. Kept the lid on a bad day and allowed the week to work out fine.

10/30/2008

Vote For Me

As the market was chopping up and down today I was watching those Milton Friedman videos on uglychart.com.

Some thoughts.

We just went through an election here in Canada and the Americans go to the polls in a couple of days. It's interesting to watch how the politicians pan for our votes. Interesting may not be the right word, disgusting may be more appropriate.

How many more years can the free world continue to exist if the only way to get elected is to promise to cut taxes and increase spending. The more important question is whose fault is that?

The answer is it’s our fault. As stated in one of those Friedman interviews we all want the government to take someone else’s money and spend it on us.

How many more years can the U.S. government continue to spend more than they take in? The current plan seems to be forever. There is no party that is going to stop it. Obama appears that he is going to get elected as he promises to spend billions. He says he will cut the same amount from somewhere. Somewhere? Where?

We all know it won't happen, the deficit will grow and the debt currently at 10.5 trillion will continue to grow.

The consumer has discovered that they can't spend more than they earn forever and businesses have always known this simple truth.

The only party that doesn’t understand this is government. If the U.S. government does not stop spending more than they take in the country will eventually collapse.

Iceland went bankrupt, so can America.

There is a simple solution, cut every single expense you can possibly cut, and then raise taxes to cover the expenses left.

That's right, cut government spending and raise taxes.

Can I count on your vote?

http://www.iousathemovie.com/

My Ugly Chart

Now that's an ugly chart.

15 Minute Mini DOW Futures Chart

The last full 15 minute bar looks good. Other than that it was a mess for me. My daily stop (question #7) kept the pain to a tolerable level.

5 trades today, 4 losers and 1 break even, 1 lonely winning tick / 43 losing ticks = RR 0.02.

We live to trade another day.

Uglychart

I wandered across this blog, http://www.uglychart.com/, and watched a bunch of Milton Friedman interviews he has posted there. Great stuff. I only have a passing knowledge of Mr. Friedman, I know the name, but have never studied his work before.

He won a Nobel prize in economics and judging by the interviews I watched I want to learn more about him.

I wonder if Mr. Friedman would have agreed with my capital is scarce theory, or at least capital is supposed to be scarce and when it isn't treated that way bad things happen?

Mr Ugly also loves Ayn Rand and called the top in the crude oil market.

So he must be a genius.

Click on the post title for a link to uglychart.

10/29/2008

The Bear is Alive!

Whatever.

I have been adjusting my trading plan these past couple of weeks and have taken some time to review my trading history and where I want to go in the future.

I have looked backward to reinforce what I believe in and answered some basic questions that I have answered before, but have drifted away from for whatever reason.

Starting with what is the basic premise that I am trading?
For me it is trading with the trend. Identifying the trend on a higher time, trading that trend on a lower time frame.

Here are some questions I have written answers for again. I’m not giving you my answers because you must trade your own answers.

1) What defines a trend?
2) What defines your entry point?
3) What defines your exit point?
4) When can you re enter the market after a trade?
5) How much are you willing to lose on a trade?
6) When, if ever, do you move to break even?
7) How much are you prepared to lose in a day?

I think the most important questions for me in that group are trend identification and when can you re enter after a trade. My diabolical need to be right manifests itself in revenge trading, which is a bad thing, a very bad thing.

These questions must have answers before you enter the market. The answers to these questions must be backed up by statistics that demonstrate your trade has a statistical edge in the marketplace.

Then you trade.

If you can think of any other questions I’m missing let me know.

Today's results were 99 winning tics / 43 losing tics = RR 2.30, 4 wins, 4 losers, 2 break evens.

I have resurrected my 34 tic range bar chart as the trend identifier. These charts show the wild moves in the last hour of the session.

Mini DOW Futures 34 Tic Range Bar Charts

10/28/2008

The Bear is Dead!

Ha ha.

We will probably go down a thousand points tomorrow.

A wild day to say the least.

My results were 180 winning tics / 21 losing tics = RR 8.57 on 14 trades. 7 winners, 5 break evens, and 2 full stops.

I moved my stop up to 10 and left the target at 25.

They say a bull market makes everyone an investing genius. The same holds true for a trending day in the markets, it makes everyone a trading genius. The key is to find a system that can take advantage of a day like this, while still being able to identify a non trending market so you don't give it all back when the market goes flat.

I'm still working on that.

Here's a 15 minute chart that shows the power move up this afternoon.

15 Minute Mini DOW Chart

Watch This


Watch CBS Videos Online

The Risk Fallacy

"But all the drama and chaos of recent months obscures the most fundamental cause of the entire financial crisis: a basic misunderstanding of risk (abetted by heavy borrowing). The paradox is that Wall Street's strategy to avoid excessive risk - by dispersing it - ended up exacerbating precisely the problem it was designed to prevent." By Nomi Prins, Fortune

Click on the read more icon for the full Fortune story.

read more | digg story

10/25/2008

SNL Again

I know I said there would be no more SNL video posted here, I just couldn't help it.

Ok this is the last one. I promise.

10/24/2008

OUCH!!

Just read Jules in Jumbles blog where she referenced this post from Dr. Steenbarger. Note my comment in the previous post about why I wouldn't just trade the last hour of the day as that is where all the money is. My answer was, I might miss a trade.

Then I read this.

Again, ouch!

1) Patience - "The ones who are afraid of missing moves, who chase moves as a result, are getting hurt. The ones who wait for clear signals and good reward-to-risk opportunities can take advantage of the volatility. The successful traders aren't afraid of missing a move; they know, in this volatile environment, other opportunities will arise." Dr. Brett Steenbarger

Stupid Doctors, think they know everything.

I added Dr. Steenbarger blog, Traderfeed, to my blog roll. I had his web site in my list before, but he only uses the blog now, so there it is.

Click on this post's title for a link to his article, Five Trading Behaviors I'm Seeing Among Traders Making Money Now.

That Was Close

The good news is we didn't make new lows on the daily DOW. So, that's the good news, ya, the good news.

Daily DOW (YM) Futures Chart

The overnight session went limit down so the market was just a tad nervous today. I found it a tough market to trade and should have stepped aside in the morning. The late afternoon session provided some nice trades and got me back in the black for the day.

You could make a nice living only trading the last hour of the day in the past month or so. So why don't I do that? I might miss a trade. My mind set, sad but true.

Depending on your definition of scalping I am either trend trading with a fixed target, or scalping. Doesn't really matter what you call it as long as it works.

I am using a 7 tick stop and a 25 tick target on the YM. I used to consider that a "trade" not a "scalp" but when I look at the number of trades at the end of the day I would now consider it scalping.

It's just scalping with a nice risk reward ratio.

I do want to cut down on the number of trades as the win rate is not where I would like it and I think I can filter some more. I have about 50 live trades to look at so I will take the weekend and see if I can identify the losing trade profile.

This is trend trading only so the obvious place to look is how you identify that a trend is place. Longer time frame chart, etc.

It is promising that you can trade rather badly and still wind up making a little money in the last 2 days.

Capital is scarce, treat it as such.

OPEC Orders Cut in Oil Production

Supply and demand coupled with fear and greed make for some very volatile crude prices. It will be interesting to see if OPEC actually comes through with the production cuts. Once you get used to $140 a barrel cash flow its hard to take a 55% price cut and then have to cut your production.

We shall see.

"The OPEC cartel ordered a cut in oil production of at least 1.5 million barrels a day. Despite the statement, a benchmark price dropped below $63 a barrel." By NELSON SCHWARTZ and JAD MOUAWAD, NY TIMES

Click on the read more icon for the full NY Times story.


read more | digg story

Mini DOW Trading Limits

Daily Price Limit

"Daily price limits and trading halts of the CBOT DJIA Index ($5 Multiplier) futures contract shall be coordinated with trading halts of the underlying stocks listed for trading in the securities markets.

Price Limits: For each calendar quarter, there shall be three successive price limits: Level 1, Level 2, and Level 3. The limit thresholds that define Levels 1, 2, and 3 shall be calculated at the beginning of the pertinent calendar quarter, using the average daily closing value of the DJIA for the calendar month prior to the beginning of such calendar quarter. The Level 1 limit threshold shall equal 10% of such average daily closing value, the Level 2 limit threshold shall equal 20% of such average daily closing value, and the Level 3 limit threshold shall equal 30% of such average daily closing value. Each limit threshold shall be rounded to the nearest fifty DJIA index points.

These three limit thresholds, so computed, shall remain in effect throughout the pertinent calendar quarter, until the next calculation. These limit thresholds shall be used to calculate price limits for each trading session within the pertinent calendar quarter, as follows:

Level 1 shall equal the settlement price of the preceding regular trading session minus the Level 1 limit threshold.

Level 2 shall equal the settlement price of the preceding regular trading session minus the Level 2 limit threshold.

Level 3 shall equal the settlement price of the preceding regular trading session minus the Level 3 limit threshold.

Price Limits During Regular Trading Hours: The following price limits and trading halts shall apply to open outcry and electronic trading, in the primary contract expiration month only, during the Exchange’s regular trading hours. For purposes of this rule, “regular trading hours” are defined for CBOT DJIA Index ($5 Multiplier) futures to begin with the time of the open for open outcry trading in DJIA futures, and to end with the later of the time of the close of open outcry trading, or the conclusion of any daytime electronic trading session that is part of the same trading day.

(a) Level 1: When the primary futures contract is limit offered at the Level 1 Price Limit, a 10-minute period shall commence. If the primary futures contract is limit offered at the end of the 10-minute period, trading shall terminate for a period of two minutes, after which time the market shall reopen. The next applicable price Limit shall apply to such reopening.

(b) Level 2: When the primary futures contract is limit offered at the Level 2 Price Limit, a 10-minute period shall commence. If the primary futures contract is limit offered at the end of the 10-minute period, trading shall terminate for a period of two minutes, after which time the market shall reopen. The next applicable price Limit shall apply to such reopening.

(c) Level 3: The Level 3 price limit shall be in effect during all regular trading hours.

In the event that trades on the electronic trading platform occur through the price limits described above, any such trades may be busted by the Exchange.

Trading Halts: If there is an NYSE Rule 80B trading halt declared in the primary securities market, trading shall be halted. Once trading in the primary securities market resumes after an NYSE Rule 80B trading halt, trading on the CBOT DJIA (DJIA) Index ($5 Multiplier) futures contract shall resume.

If an NYSE Rule 80B trading halt becomes inapplicable, the corresponding Price Limit shall likewise become inapplicable. E.g., if an NYSE Rule 80B trading halt, triggered by a 10% or a 20% decline in the Dow Jones Industrial Average, has been declared in the primary securities market, and trading in the primary securities market has recommenced, then the 10.0% or 20.0% Price Limits shall become inapplicable, respectively. E.g., when the NYSE Rule 80B 10.0% price limit provisions are suspended after 2:30 p.m. Eastern time, then the 10.0% Price Limit shall become inapplicable. Trading on the CBOT DJIA (DJIA) Index ($5 Multiplier) futures contract shall continue and the next applicable Price Limit shall apply.

Opening Time: If either a trading halt was in effect or the primary futures contract was locked at a limit at the close of trading, then the opening time of trading on GLOBEX® shall be delayed until 6:00 p.m.

During Electronic Trading Hours (ETH), there shall be no trading of CBOT DJIA Index ($5 Multiplier) futures at a price more than the 5.0% Price Limit above or below the Reference RTH Price. If the market is limit bid or limit offered during a period commencing two minutes prior to the opening of RTH, there shall be a trading halt in effect until the commencement of Regular Trading Hours (RTH). Once RTH commences, the next applicable trading limit shall be in effect.

The 5.0% Price Limit shall be calculated as one-half of the Level 1 or 10% price limit rounded down to the nearest integral multiple of 10 index points."

Source CBOT Web site

10/23/2008

The Name Has Changed

Trading crude oil becomes capital is scarce.

The re name the blog poll died from boredom and I unilaterally chose the new name. Again the reason for the change is I have started trading the equity futures again. So, trading crude oil didn't seem to fit anymore.

I will go back to crude oil again I'm sure, but for now the DOW is the thing to trade.

Today's trading was live and profitable. The chart was a mixture of some things I learned from my scalp test, my old trend system, and some Irish mystical nuances.

I'm not posting anything until I get the plan straight.

10/22/2008

Humbug

I have a feeling I'll be looking at this tomorrow. (click on chart to view)


Counter Trend Scalp Test
Gross RR 1.59
Win 59%
Net Average Trade $4.97
Winners 58
Losers 40
Total Trades 98
Net Income $486.60
Average Trades Per Day 20
Days 5
Average Daily Net Income $97.32

Traded it live today and our old friend Mr. Slippage took his cut.

Bottom line is it's not good enough. This trade was my adaptation of someone else's trading plan. It reinforces my renewed belief that you can't trade someone else's plan with your money.

The "exceptional Irish trader" is still poking me in the eye with a sharp stick, but apparently I'm a slow learner.

Back to work tomorrow, and I get to keep my turtle trading fan club membership.

10/21/2008

Grunt Work

Here are the stats for a 4 day scalp test I ran. Real time sim trades.

I have a confession to make, they are all counter trend trades.

Gasp.

I know I know, I may have to turn in my turtle trading fan club membership.

Gross RR 1.73
Win Rate 62%
Net Average Trade $6.73
Winners 53
Losers 32
Total Trades 85
Net Income $571.98
Average Trades Per Day 21
Days 4
Average Daily Net Income $143.00

So where do I go now? Is this good enough to risk capital?

The "exceptional Irish trader" has been poking me in the eye with a sharp stick about this counter trend thing. He wants me to try a trend scalp. So the question is can a trend scalp work, and would it work better?

There is only one way to find out.

10/20/2008

Laid Off By Lehman: One Broker's Story

This is priceless, in a sad sic kind of a way.

Scalping

"The act of removing the scalp, usually with the hair, as a portable proof or trophy of prowess in war." Wikipedia

Or

"A trading strategy that attempts to make many profits on small price changes. Traders who implement this strategy will place anywhere from 10 to a couple hundred trades in a single day in the belief that small moves in stock price are easier to catch than large ones." Investopedia

I have been sim trading a scalping plan on the YM (mini DOW) for the last 3 trading days. Results to date are looking positive. I need one or two more days to see if it is worth trying live.

I had a audio file sent to me discussing trading psychology, and using a plan that had a higher win rate then your standard trend following plans. The idea being that traders fail with low win rate plans as they become discouraged and deviate from the plan.

Sound familiar to anyone?

So as the volatility in this current market has made it very difficult to trade with out drastically increasing your stops I thought I would give it a try.

This is very different trading than what I am used to.

We shall see.

What’s Really Wrong With the Price of Oil

Photo Illustration by Dan Winters. Metal Fabrication by Justin Halliburton

"Winter is coming. The economy is in crisis. People are fearful. So why should we hope oil prices don’t fall too far?" By ROGER LOWENSTEIN, NY TIMES

Click on the read more icon for the full NY Times story.


read more | digg story

10/18/2008

I Love the Smell of Pure Capitalism in the Morning

This is classic Kevin O'Leary.

Click on the post title to view.

Enjoy

http://watch.bnn.ca/squeezeplay/october-2008/squeezeplay-october-17-2008/#clip103829

10/17/2008

Warren Buffett: Buy American. I Am.

"I’ve been buying American stocks. Why? A simple rule: Be fearful when others are greedy, and be greedy when others are fearful." Warren Buffett

I, and many others, have always stated that the key to successful trading is the ability to reverse fear and greed. As Mr. Buffett so aptly states it is also the key to successful investing. So calm down, make sure you understand the businesses (stocks) you own, and if you have cash now may be a great time to deploy.

Stupid money is selling.

Smart money is buying.

If you can't find any quality American stocks, buy Canadian. :)

Click on the read more icon for Warren Buffett's full NY Times editorial.


read more | digg story

10/16/2008

Depressed Canadian oil giants ripe for takeover

Chris Schwarz/Canwest News ServicePipelines carry steam to Suncor's oil sands operation north of Fort McMurray.

CALGARY - "Canadian oil and gas companies are ripe for becoming merger bait -and we're not talking about the small and medium-sized shops." Carrie Tait, Financial Post

Click on the read more icon for the full Financial Post story.

read more | digg story

Crude Oil Daily Chart


Crude oil breached $70.00 today. The question of how low crude oil will go is on every one's mind again. Crude oil went too high and it will go too low. If you are long oil companies I would stay there and wait it out.

The oil majors have billions of dollars in cash from the $140 oil days, and with the depressed prices they will be out shopping. The oil business is going to consolidate some more and right now Canadian oil companies’ look like Angelina Jolie at an all boy’s school.

10/15/2008

I Need a New Name

Since the DOW is now officially insane it looks like I will be trading it for a while. My trading plan states that between the YM and the CL I trade the one with the highest 5 day ATR. The YM is winning that one hands down right now.

The blog title, Trading Crude Oil, doesn't seem to quite fit anymore. I will trade crude oil again but I need a more generic name.

So I have decided to have a name the blog contest. The winner will receive my heartfelt thanks.

The tradingcrude url will remain because even if I am trading something other than crude oil my trading is always "crude".

I have started a poll in the top right column with some of my thoughts, which are all lame. Please vote, or if you have a better idea please comment.

Keep it clean. :)

Oh ya, I reserve the right to ignore the poll, all comments, and come up with something else.

A Minor Blip

100 Year DOW Chart (click on charts to view)


Yes it seems like this is the end of the world as we know it. In actual fact it is just the end of the world as we remember it.

Humans have very short memories. In trading we call it recency bias, if the market goes up for 5 years in a row we think it will always go up.

It doesn't.

Some times it goes down.

Alot.

You have to knock another 1500 points or so off that chart, down to 8500 or so, but it gives us the picture we have all forgotten. In the long run, the market goes up.

Today's trades on a 13 tick YM Renko Chart

10/10/2008

Trading Insanity

Not sure what to say. I'm tired.

Traded the YM again. I was up, I was down, I was up again.

One thing that was evident today was the benefit of renko bars and limit stop orders for entry.

I switched to a 10 tick renko bar so I could do the math quicker. The renko bars only print if you get the 10 ticks in one direction, so you know where the bar is going to fill. When price is getting close to your trigger point you place a limit stop order ahead of the current price. So when the market is moving like this your not chasing price, you are sitting there waiting for price to come to you.

Also means you sometimes get filled on the last tick in that direction.

I was on sim again today, which without the benefit of hindsight was the right move. Looking at all those sim dollars at the end of the day is a little tough.

Not going to post stats as I was tweaking the trade throughout the day. I'll post a few charts that show the big moves, but remember there were many trades with nothing but chop as well.

They're just not as much fun to look at.

10 Tick DOW Mini Futures Charts (click on charts to view)

10/09/2008

Sad Looking Charts

Daily DOW Futures Chart


Daily Crude Oil Futures Chart


What can I say, the pictures tell it all.

If you hold investments in retirement accounts, check the level of debt in the companies you own. If they are not highly leveraged close your eyes and hang on.

Don't be scared into selling, look at the fundamentals of the companies you own. You were supposed to do that before you bought them, better late than never I guess.

Hedge funds are selling stock because of margin calls, mutual funds are selling stock because of unit holder redemption's.

Stupid money is selling.

Smart money is buying.

Warren Buffett is buying.

10/08/2008

Trading Crude Oil Steps Out

I feel a little guilty. The blog is called trading crude oil and today I traded the DOW Mini, the lowly YM, the beginners contract, the slow boring DOW Mini.

Oh the humanity.

My trading plan, the dusty part that is, states that I am following 2 contracts, CL and the ER2. The plan states that I trade the one with the highest daily 5 period ATR. Since the ER2 never came close to the CL I just forgot about it. Then it got ICEd.

So with the market turmoil and the urging of an "exceptional Irish trader" I have been looking at the YM. Low and behold the market is so volatile it's 5 day ATR is higher than crude oils. On a tick basis that is, on a dollar basis the CL is still larger. But as we know we don't trade dollars, we trade ticks.

So, not sure if I have to have a rename the blog contest yet or not.

This market action is just a tad out of the ordinary so I won't be doing anything rash.

Today was all on sim and there are way too many trades to post. I traded a 8 tick renko bar chart, used a 9 tick stop, moved to BE + 1 at 10 ticks, trailed the stop at 21 ticks, and had a 100 tick target. Exit was on the trailing stop or target.

Had 52 trades. LOL. That is not a misprint, that's insane. That is not any where near normal YM action. I also need to confirm a minute bar chart for trend and only trade in that direction, which I didn't really do today.

19 winners, 18 losers, and 15 BE + 1s.

Winning ticks 692 / losing ticks 183 = RR 3.78

A couple of charts.

8 Tick DOW Mini (YM) Renko Bar Charts


I hope you, my loyal readers, can forgive me.

All you never knew about Warren Buffett

Biographer Alice Schroeder spent 300 hours with Warren Buffett, and had access to his private papers, his family and cronies.

"The Snowball: Warren Buffett and the Business of Life is the mandatory book to read in these treacherous times of financial crisis. Alice Schroeder, formerly an astute insurance analyst with Morgan Stanley, has written a thoughtful and intimate biography of the globe's wisest investor." Robert Lenzer, Forbes

Click on the read more icon for the full Financial Post story.
read more digg story

The Charlie Rose interview with Warren Buffett.

10/07/2008

10 Questions For Life

If the recent market "events" have you feeling a little uncertain of your financial future I offer to you, 10 Questions for Life and the corresponding 10 Financial Rules for Life.

This is a blatant plug for a non commercial blog hosted by a old banker.

Here you go.

1) Do you know where and how much money you spend every month?

2) Do you have any savings?

3) Do you pay off your credit card every month?

4) Do you know how much money you will need to retire on?

5) Do you know your net worth?

6) Do you know how much debt you have?

7) Do you teach your children how to handle money?

8) Do you invest on a regular basis?

9) Do you give money to charities?

10) Are you happy?

If you answered no to some, most, or all of these questions then the 10 Financial Rules for Life may be of some help to you.

Click on the post title for the 10 Financial Rules for Life or copy and paste this link.

http://financialliferules.blogspot.com/

10/06/2008

Experts sure oil will go to $150 or $50

Ted Rhodes/Canwest News - Service Lights glitter as the sun sets on Syncrude's upgrader plant at the oil sands project north of Fort McMurray.

CALGARY - "Is the bank bailout a boost or a drag for oil prices? Depends whom one asks -- and on one's time horizon." Claudia Cattaneo, Calgary Bureau Chief, Financial Post, With Files From Bloomberg News


This clears things up nicely.

Click on the read more icon for the full Finacial Post story.

read more digg story

Market Meltdown!!!

Sorry, just thought I would add some fuel to the flames. Actually I was part of the solution today as I was not selling anything, in fact I was buying stock today.

However in the crude oil market I was selling.

We broke $90.00 today and I don't see a floor anywhere, so stop asking me how low will crude oil go.

Daily Crude Oil Chart (click on charts to view)


13 Tick Crude Oil Renko Bar Charts

10/05/2008

No More SNL Video Posted

Ok just one more time.

10/03/2008

Congress Passes Historic Bill.... Yawn

"Dang, the market was supposed to go up.
We can't have a recession, we don't want a recession, things are supposed to go up, they always go up, why aren't they going up?
Stupid economy." American Politician

Ok maybe it's more of a paraphrase. :)

The only quiver left in the U.S arsenal are interest rate cuts, 2.00% left to go until they hit zero.

Then what?

On the brighter side we now see survivor banks (Citibank & Wells Fargo) competing over a non survivor bank (Wachovia). This is a good sign, in fact this is how capitalism is supposed to work.

The strong eat the weak.

Crude oil had some nice moves today. I got stopped out of the first one and will have nightmares over that one all weekend. Caught some cheese on the others and had a nice day.

13 Tick Crude Oil Renko Bar Charts (click on chart to view)

10/02/2008

I Found John Galt!

His name is Thomas Barrack Jr., founder, chairman & CEO, Colony Capital LLC. In my opinion this man has the most intelligent information I have heard on the subject of the American credit crisis.

This is a must see, so take the time and watch this.

I don't have video that I can embed, so click on the post title, or copy and paste the link below.

http://watch.bnn.ca/squeezeplay/october-2008/squeezeplay-october-2-2008/#clip98221

The crude oil trade is getting close to our recent lows, if we breach $90.00 things could get interesting.

Daily Crude Oil Chart

10/01/2008

Floored, Standing in the Twilight of Open Outcry

I'm looking forward to the release of this film, coming sometime in 2009.

The film shows the action on the trading floors and discusses the pending demise of the open outcry trader as electronic trading takes over.