Showing posts with label 5 minute crude oil chart. Show all posts

6/19/2009

What Happened?

Crude got whacked, that’s what happened. Bloomberg and Reuters say it was due to gasoline inventories rising and demand falling.

Solfest says it was traders taking profit before the weekend.

I did not trade well today and was on the sideline as the bottom fell out.

C'est la Vie.

5 Minute Crude Oil Chart
1 Minute Crude Oil Chart

2/25/2009

A Slight Tweaking

I have made a few slight adjustments to the magic blue bars as I have been suffering a major lack of magic these last few weeks. The parameters for the indicators are roughly the same but I have shortened the length required to obtain those parameters.

For example the 5 minute ATR and ADX are now a 5 period instead of an 8 period.

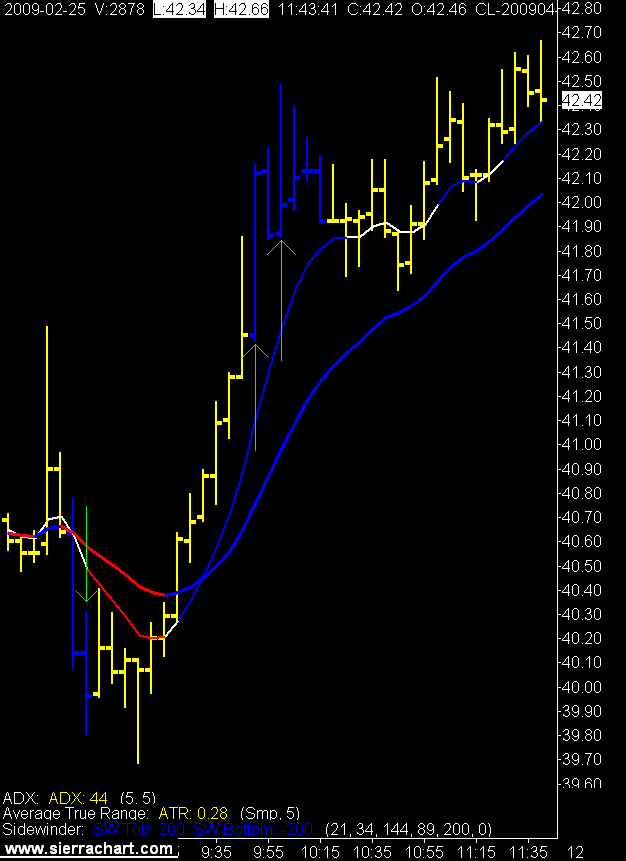
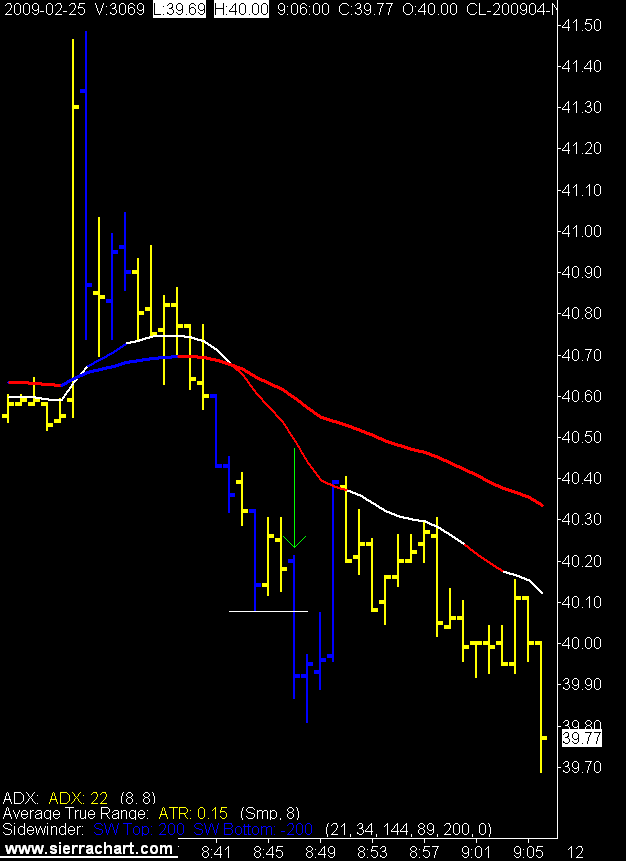
Barrel count today and you see the crazy price action on the 1 minute chart at 8:30 MST. That kind of price action is tame compared to how it used to act, back in the good old days.

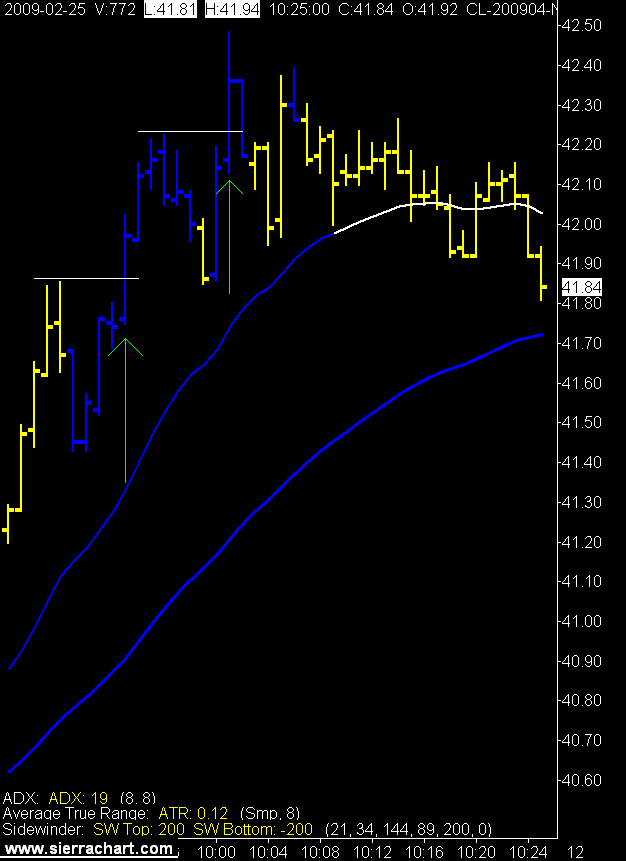
I missed the first trade and caught the next 2, one for full target and one partial.

5 Minute Crude Oil Chart

1 Minute Crude Oil Charts

2/20/2009

Another Long Day

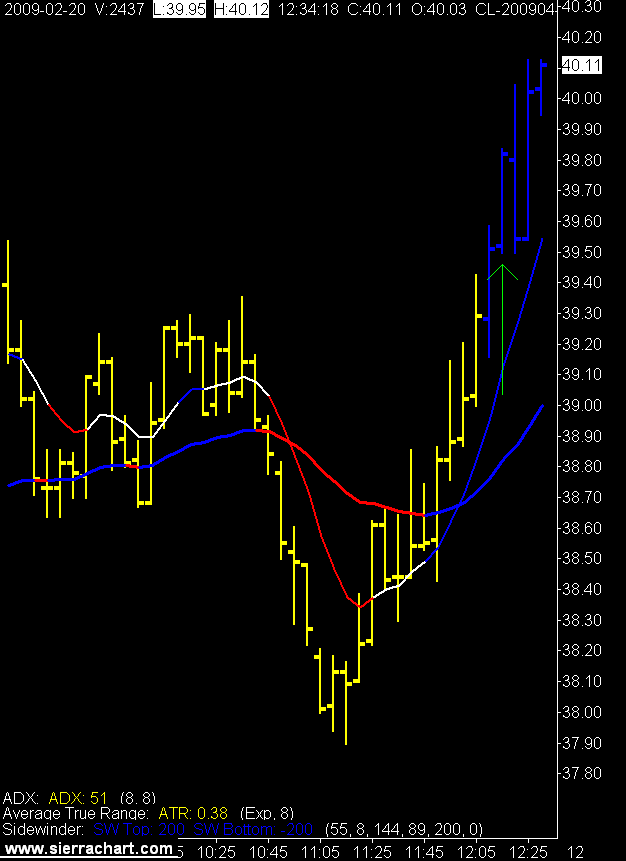
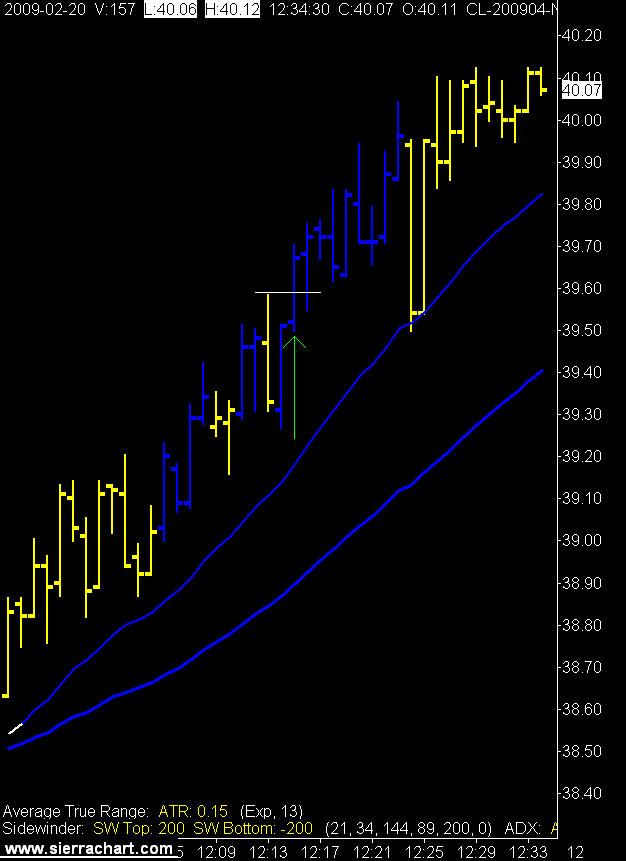
One signal two trades. :)

The non signal trade was blue on the 1 minute but not on the 5 minute. You have my sincere apologies. The signal trade was a slow one and came within 3 tics of target. Trailing stop exit.

Yes indeed, a rather long day for little reward.

I wonder what blue bars look like on a gold chart?

5 Minute Crude Oil Chart

1 Minute Crude Oil Chart

Some good video on the old blog this week. Have a nice weekend and give them a watch.

2/10/2009

Super Genius

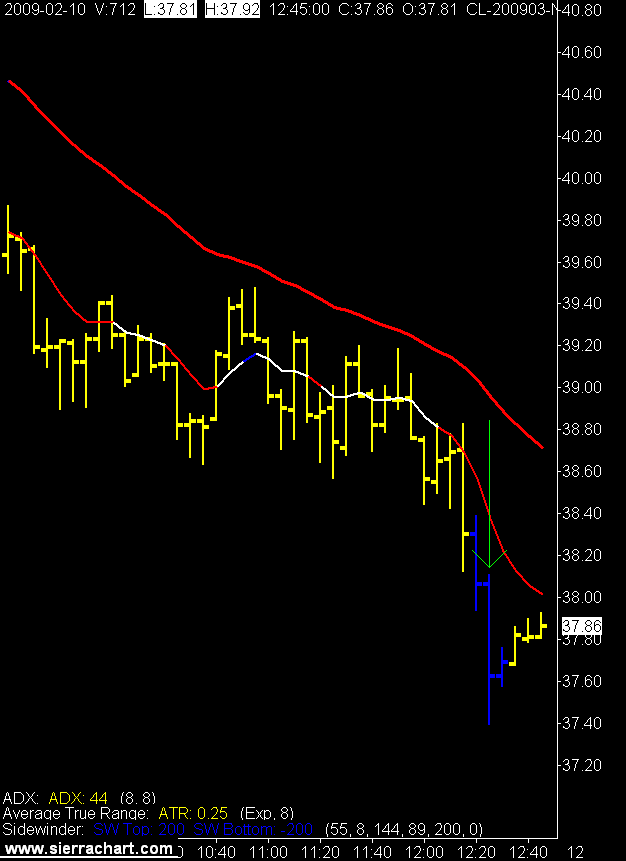
Some days you can research, plan, execute your plan, think happy thoughts, and you still don't catch the road runner. Timothy Geithner's plan had the same kind of day.


5 Minute Crude Oil Chart

1 Minute Crude Oil Chart

1/30/2009

Saved by the Bell

The week was a giant bore. The best thing about it is, it's over. Five day ATR for crude is 340 tics which is very low. I guess you have to factor in that this is a 41 dollar contract now, not a 140 dollar one.

I'm happy with the inherent risk management in the "blue bars" as adding range to the trend equation has kept me flat for most of the week.

Flat was the correct position.

We shall see what next week brings.

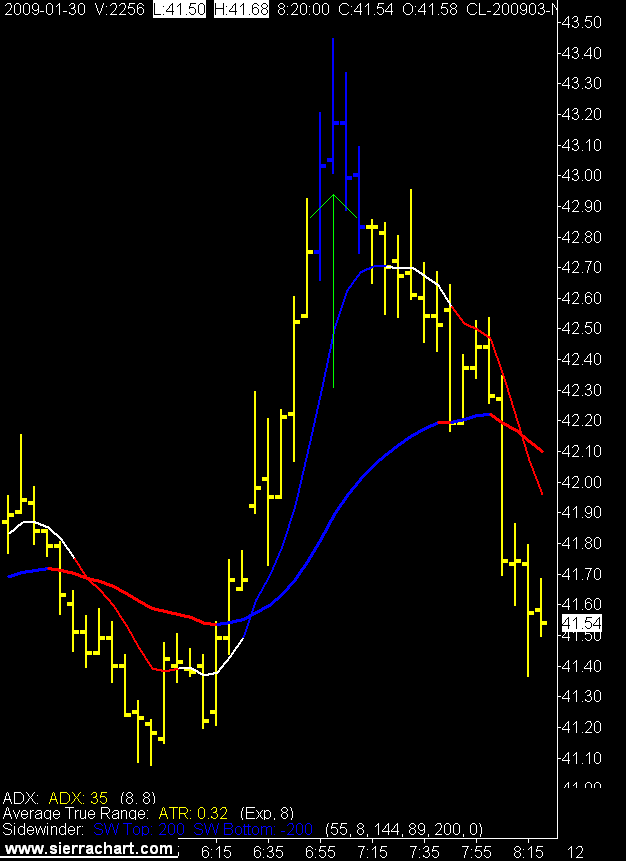
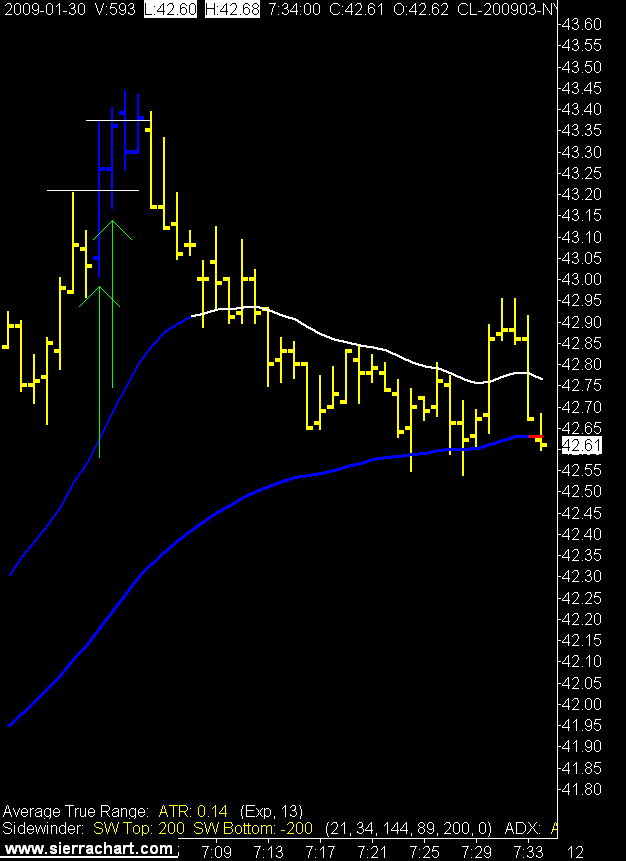
Two swings at the CL today for a net result of -8 tics.

5 Minute Crude Oil Chart

1 Minute Crude Oil Chart

1/27/2009

Harmony

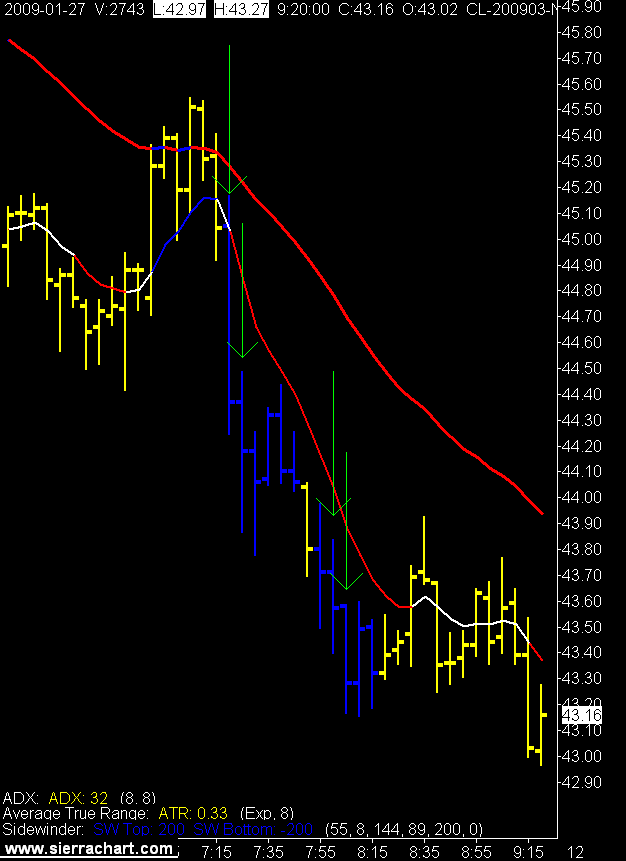
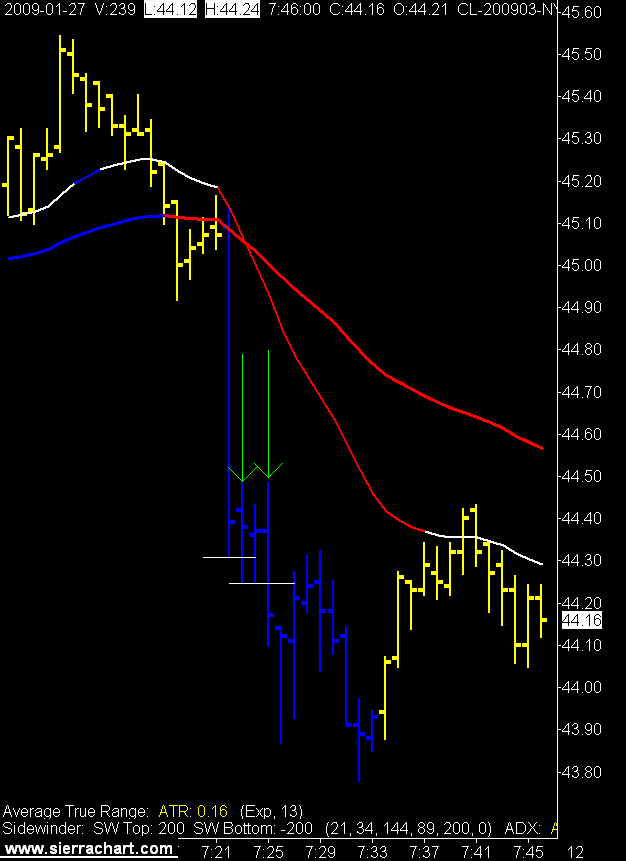
The man and machine were one today. The machine identified high probability time periods and the man made sound entry decisions.

We lost money, but we were one.

Actually did trade well, took the first set up as it appeared, and then another swing as the trend stayed in place. Missed one target by 3 tics which would have made the day green.

That's trading.

I did not revenge trade, I did not pass up opportunities, I did my job.

Some days you do it all right and you lose.

On another note it turns out the EIT (Exceptional Irish Trader) is also a EIP (Exceptional Irish Painter) take a look at his gallery.

5 Minute Crude Oil Chart

1 Minute Crude Oil Charts

1/23/2009

I am Not a Human

I am a trader.

An emotionless, humourless, colourless, heartless, trader.

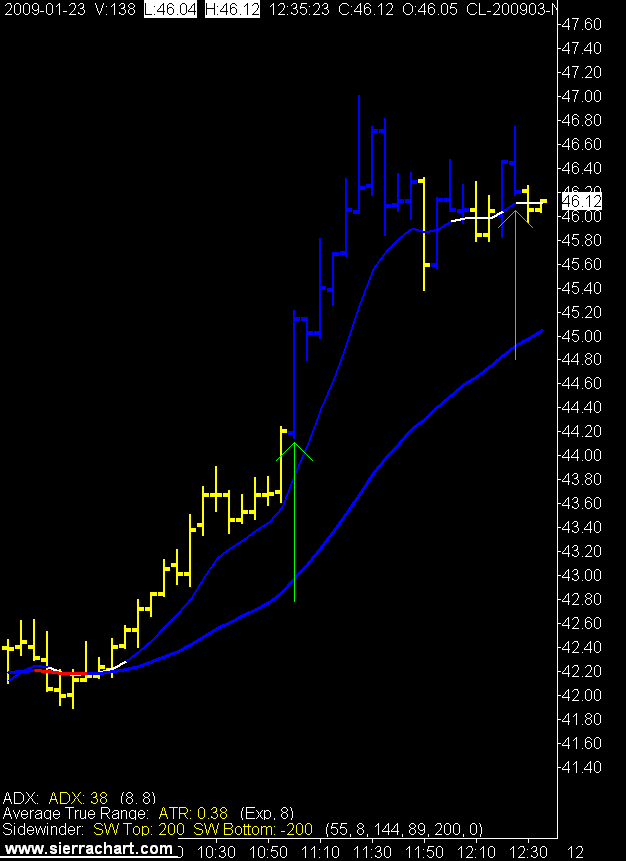
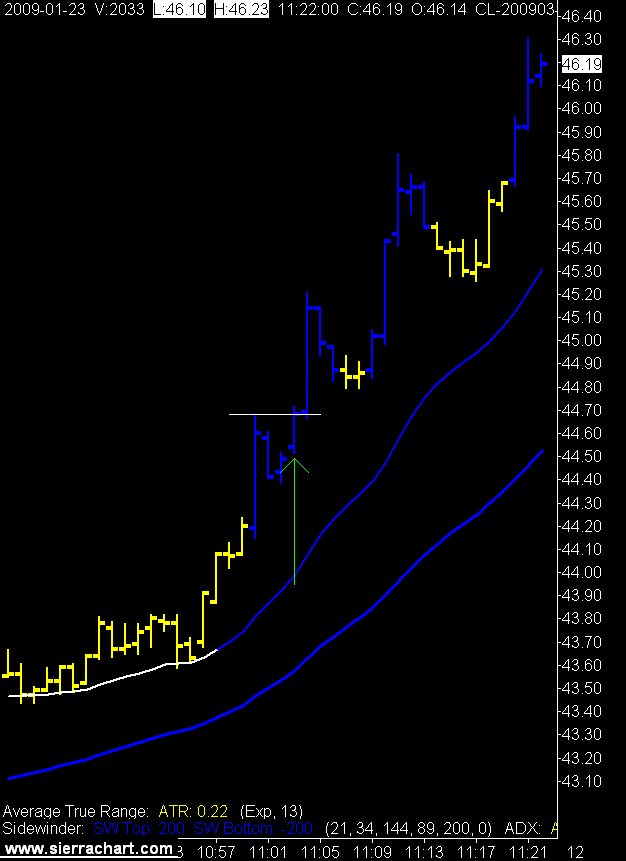
I sit and I wait. I wait for the machine to tell me it's time to trade.

Then I press a button.

The machine places the order, the stop, and the target.

The machine moves the stop to break even.

I sit and watch, expressionless, eyes glazed over.

I accept the outcome of the machine's work.

I have no joy or sorrow with that outcome.

I am a trader.

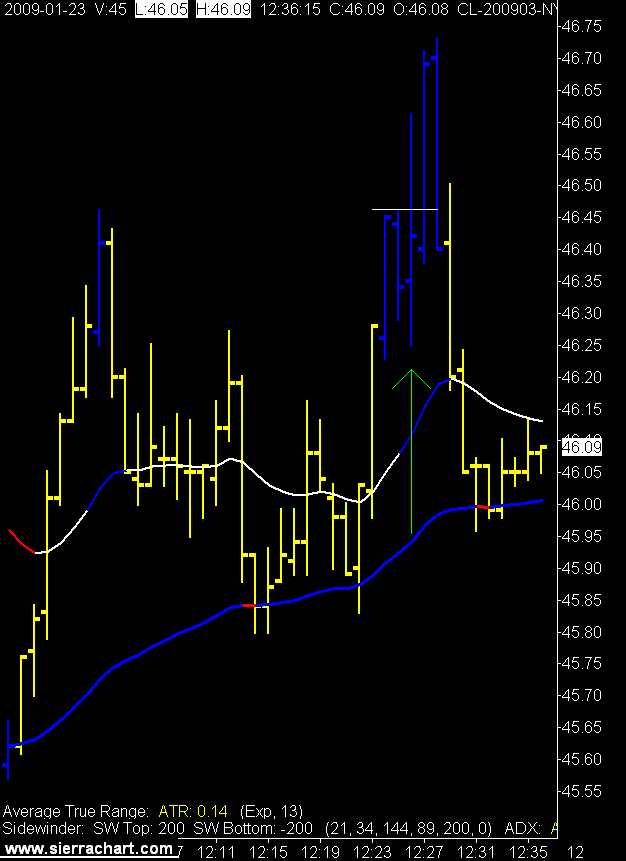
5 Minute Crude Oil Chart
1 Minute Crude Oil Charts
Trade number one result: Target achieved and accepted.

Trade number two result: Break Even achieved and accepted.

1/20/2009

Shiny and New

A new crude oil month, a new President, onward and upward my friends.

I'll leave the new President alone for now (so LT doesn't get mad at me) and concentrate on the new crude month.

A very strong up move in the morning brought forth a plethora of 5 minute blue bars. I took the first trade, bagged my target, and congratulated myself for the very self evident genius at work.

Then came the second trade.

Twas not my fault, I swear.

Limit long at 42.38, price on the chart does not go over .36, I get filled at .37, price then plummets through my stop and I bail for a 25 tic loser.

Nice.

The signal was still intact, and technically my entry price was not hit so I went again at 42.38 and got a BE + 1. Well this is crude oil, so the fill was BE - 1.

Sheesh.

These things happen, I want a product that moves, and I got one. Day was net positive so I guess it could have been worse.

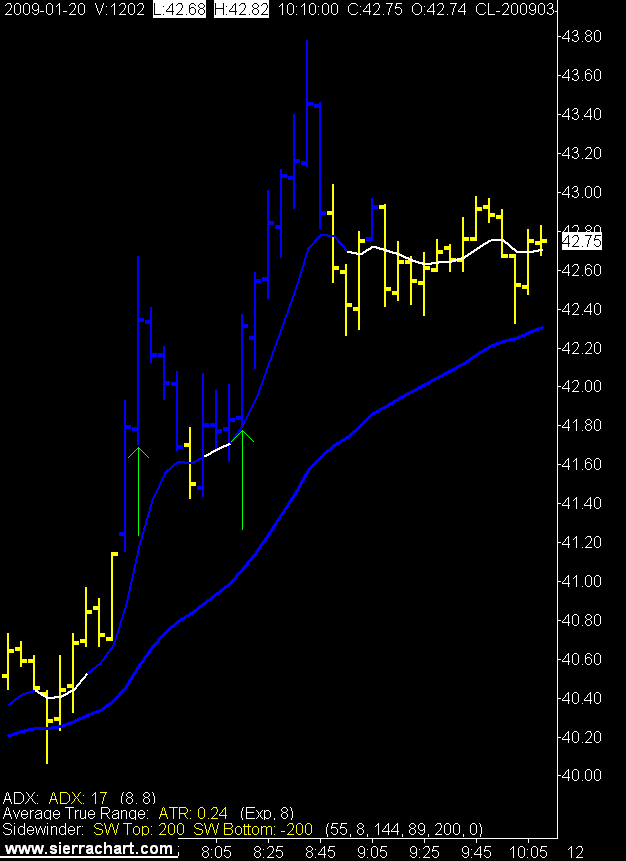
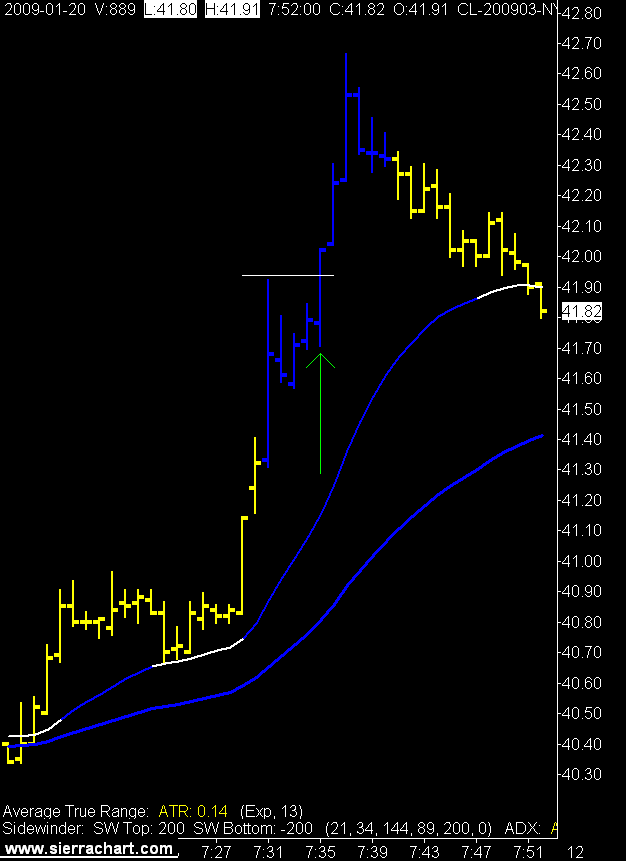
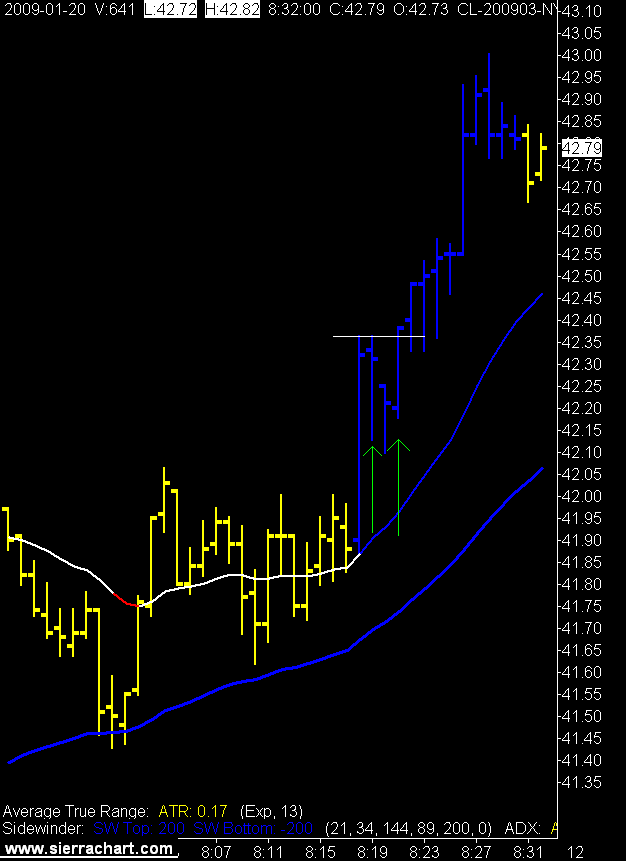
5 Minute Crude Oil Chart

1 Minute Crude Oil Charts

1/13/2009

How Low Will Oil Go?

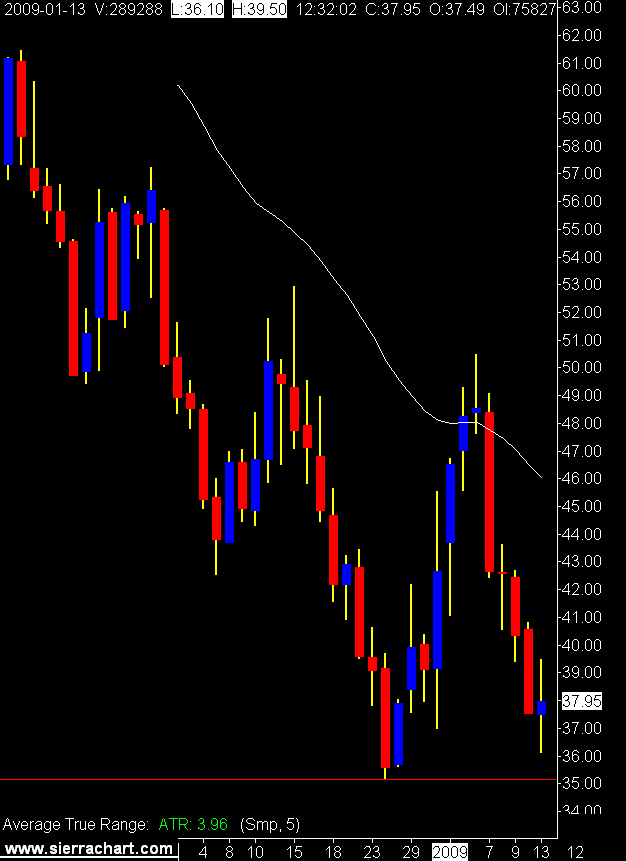
I don't know why I ask this question. I guess I ask because it's the question most people ask me. My answer is always the same, I have no idea.

All I can say is the trend is still down. It will remain down until it is up.

Daily Crude Oil Chart
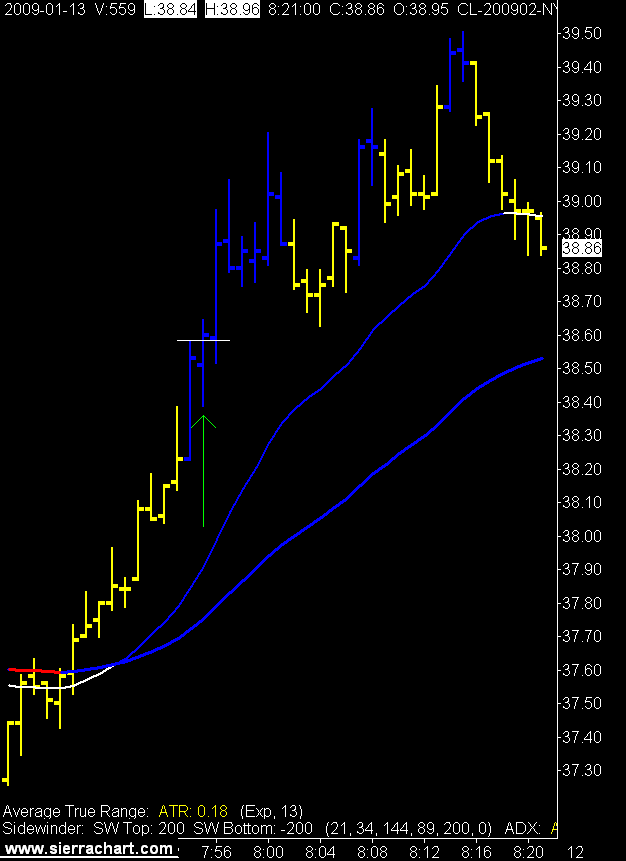
This is a very strange business, spent 6 hours looking at charts, made one trade, held the position for about a minute, and that was it for the day.

5 Minute Crude Oil Chart

1 Minute Crude Oil Chart

1/09/2009

A Trade

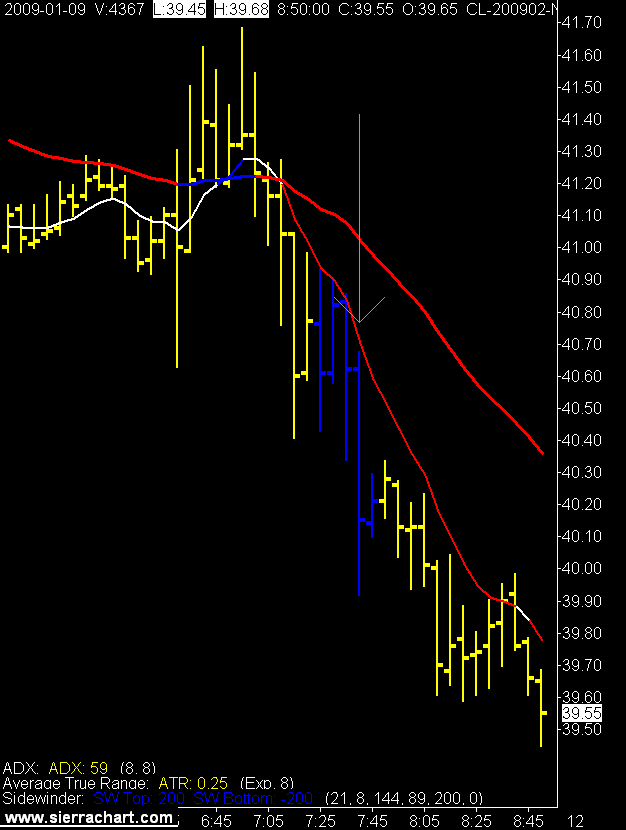
One lonely trade. Tis better than nothing.

I was teaching the EIT again today, teaching him about the markets, economics, and life in general. He's like a sponge, so young, so eager to learn.

EIT I said, it’s not your trading system that makes you money, it's trading the right market conditions. If the market conditions are not right, don't trade, or trade a different market.

He looked up at me with those I'm so glad you’re my mentor eyes and said, yes Mr. Solfest.

My capacity for the welfare of my fellow man amazes even me sometimes.

5 Minute Crude Oil Chart

1 Minute Crude Oil Chart

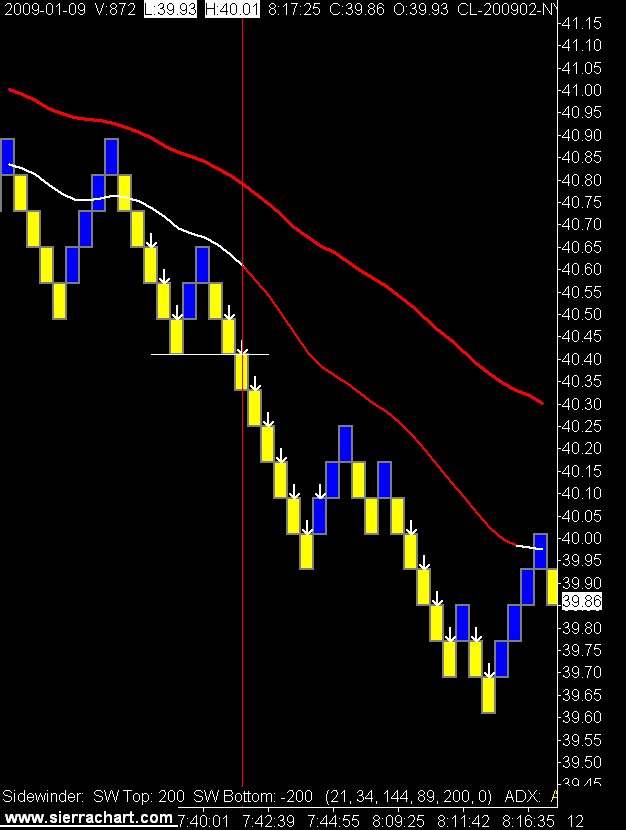
8 Tic Renko Crude Oil Chart

1/02/2009

New Year Crude Oil

There are some who pontificated that it was the price of crude oil (energy) that caused the current global recession. If so you would think that the subsequent collapse of crude oil prices would help move the economy back into the black.

What does this little crude oil rally mean for the economic outlook?

Is oil looking forward?

If so it ran to $147 with a blindfold on.

Is the current oil price just a reflection of a lower American dollar?

I have more questions than answers.

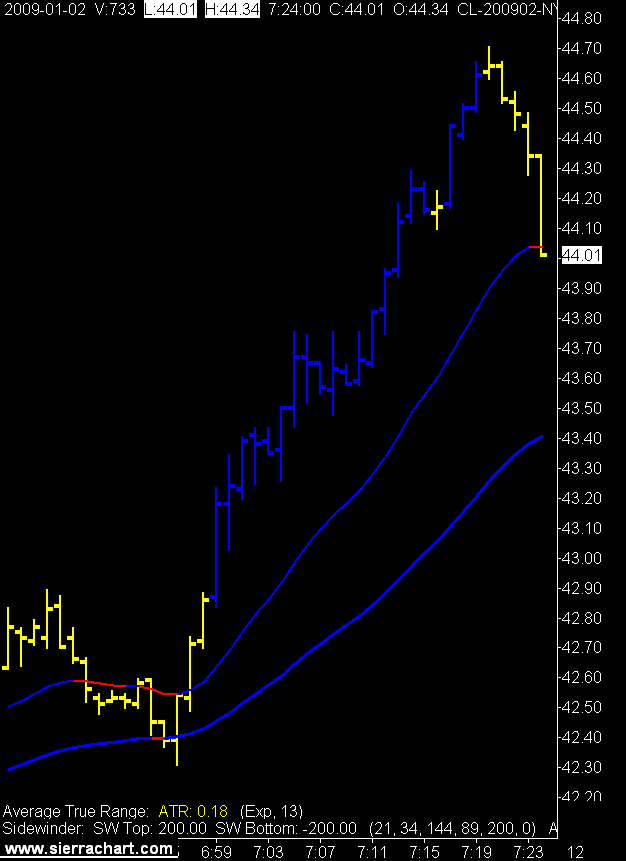
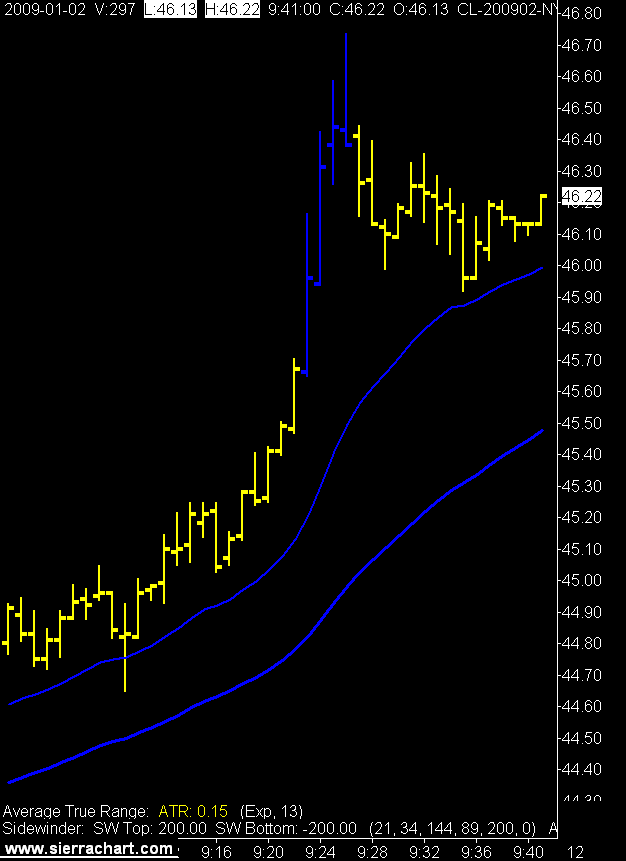
For whatever reason crude has come back to life over the past few days and has shown some decent intra day range. Decent compared to the YM's range that is. I am currently simming crude oil with the magic blue bars and caught a few nice trades today.

The YM had no signals and no trades.

5 Minute Crude Oil Chart

1 Minute Crude Oil Charts

12/31/2008

My Old Friend

Crude oil.

Remember him, or is it her, probably him, it's crude.

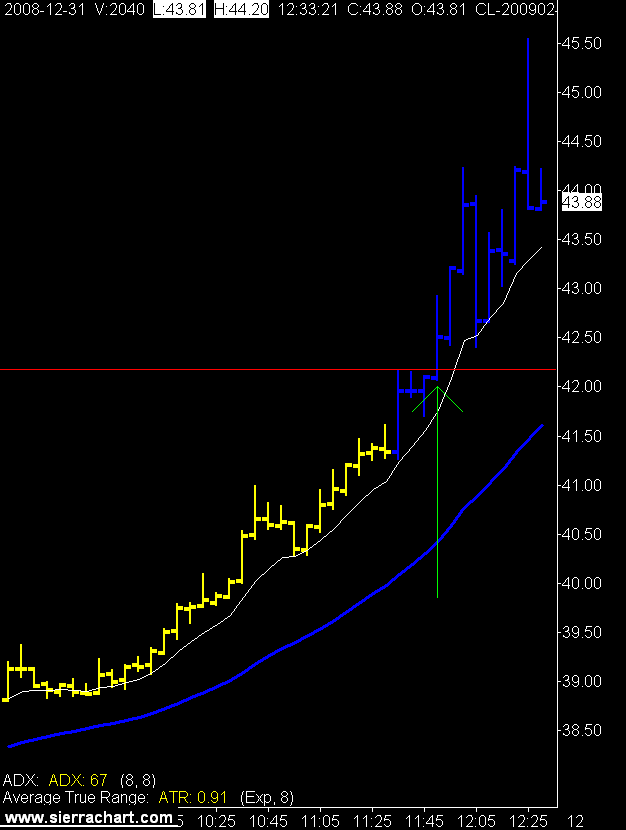
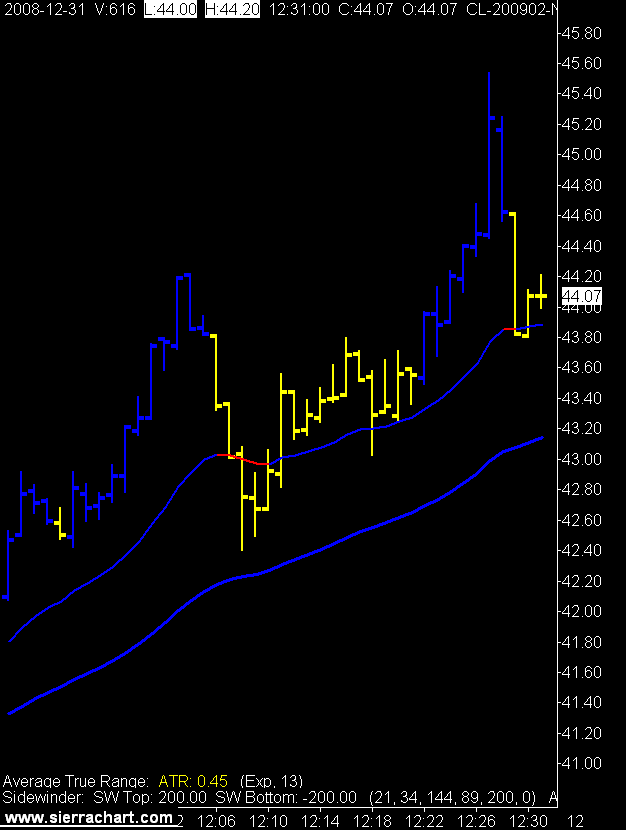
Using the same trade criteria for crude, programmed in sierra, as the YM. Difference being crude oil actually moved. I will wait and see what the first week of January brings but may be moving back to crude oil if the YM doesn't start getting some intra day range.

Started looking for trades on the renko and 1 minute charts after price broke through (arrow) on the 5 minute chart with blue bars in place.

5 Minute Crude Oil Chart

1 Minute Crude Oil Chart