WARNING: This post is very long and has no pictures. If this alarms you skip down to the next post which has few words and shiny pictures of charts.
Pandu the FX trader from Australia asked me this on an old post.
"I want to know what do you mean by 'The hard stop value is set as a % of the range bar we are trading.'. What is the meaning of 'Range Bar'? Also, what parameters do you use for the ADX you use?"
So that along with all the google searches for renko bar trading I get on this blog I thought I should take a moment and discuss why I quit using range bars and or renko bars.
In a word, time.
We all have access to the same data, we all live in the same space and time continuum. I heard that on Star Trek I think.
I don't move the market. I want to be looking at what most everyone else is looking at. Why? Because I'm going to ride along with whomever, collectively or all by themselves, does move the market.
So we're all looking at price move and we are all breaking down that price action with different methods. We have volume, time, and tick data and all of it tracks the same price but presents the trader bar closes in different ways. I want to look at the chart picture with the method, time, that I think most other traders are using. Note I said think, not know.
Of course everyone who uses one of those categories thinks it is the best. Until they change, just like I have. :)
Back to Pandu's question. The range bar measures a set range of price movements and when that range is met the bar prints.
A renko bar does the same except the range has to be all in one direction for the bar to print. So with a 10 tick renko bar the range has to be all up or all down for it to print. A 10 tick range bar could open at 70.25 and have 5 ticks up to 70.30 and 5 ticks down to 70.20 and the bar would print. A 10 tick renko bar would have to have 10 ticks up to 70.35 or 10 ticks down to 70.15 before it would print.
There are other little nuances to them both depending on your chart service but I'm not going into that here.
Got it? I hope so it exhausted me explaining it.
So the benefits to both are when price moves quickly the bars start printing. We need the bars to print in order for our indicators to, well, indicate. It may be a shock for some but all our indicators are lagging. Sorry. They need the price bars to move in order for them to do their "magic".
This all sounds good and works for many people, like the man who loves rain (Rainwater) and really wants to be included in Jules private blog but is too shy to ask. (Rainwater uses range bars not renko bars)
Actually it sounds so good it's making me wonder why I gave them up?
Renko, I gave up because there can be too much intra bar movement and it is too hard to find your way in with renko alone. I started using time charts with renko and then eventually just dumped the renko. Renko charts are great for keeping you in a trade and could be used for a technical exit, but then I started trading for a target rather than a technical exit so renko went bye bye.
Range bars are probably of more use but I found they gave me too many false starts and I need to control my pushy the button fingers.
I control them with time.
Time, I have to wait. I use 1 and 2 minute bars so I don't wait for long but for me, let me say again, for me, I find that time works the best.
Am I late sometimes? Yes. I give that up in order to stay out of some false moves.
So there it is, my trading still looks at range via the ATR, I need to see some movement in one direction via the ADX, I need price on the right side of the EMA's, I look for a higher high or lower low and away we go.
The longer multiple EMAs are there to simulate what a longer term chart would be showing in terms of trend and direction. Like a 5 and 15 minute chart or so.
This is a very long post with no pictures which may be alarming to some. I better place a warning at the top of this post.
Oh yes the rest of Pandu's questions. My stop on the range or renko bar was a % of the bar I was using. So for a 20 tick range bar I may use 75% of that as a stop, 15 ticks. With the ADX and ATR I am looking for a minimum threshold to be met before I start looking for signals. That's all.
P.S. Those renko bar charts were sure pretty.
Home
Showing posts with label renko bars. Show all posts
Showing posts with label renko bars. Show all posts
8/03/2009


8/19/2008
Renko Rides Trend to the End
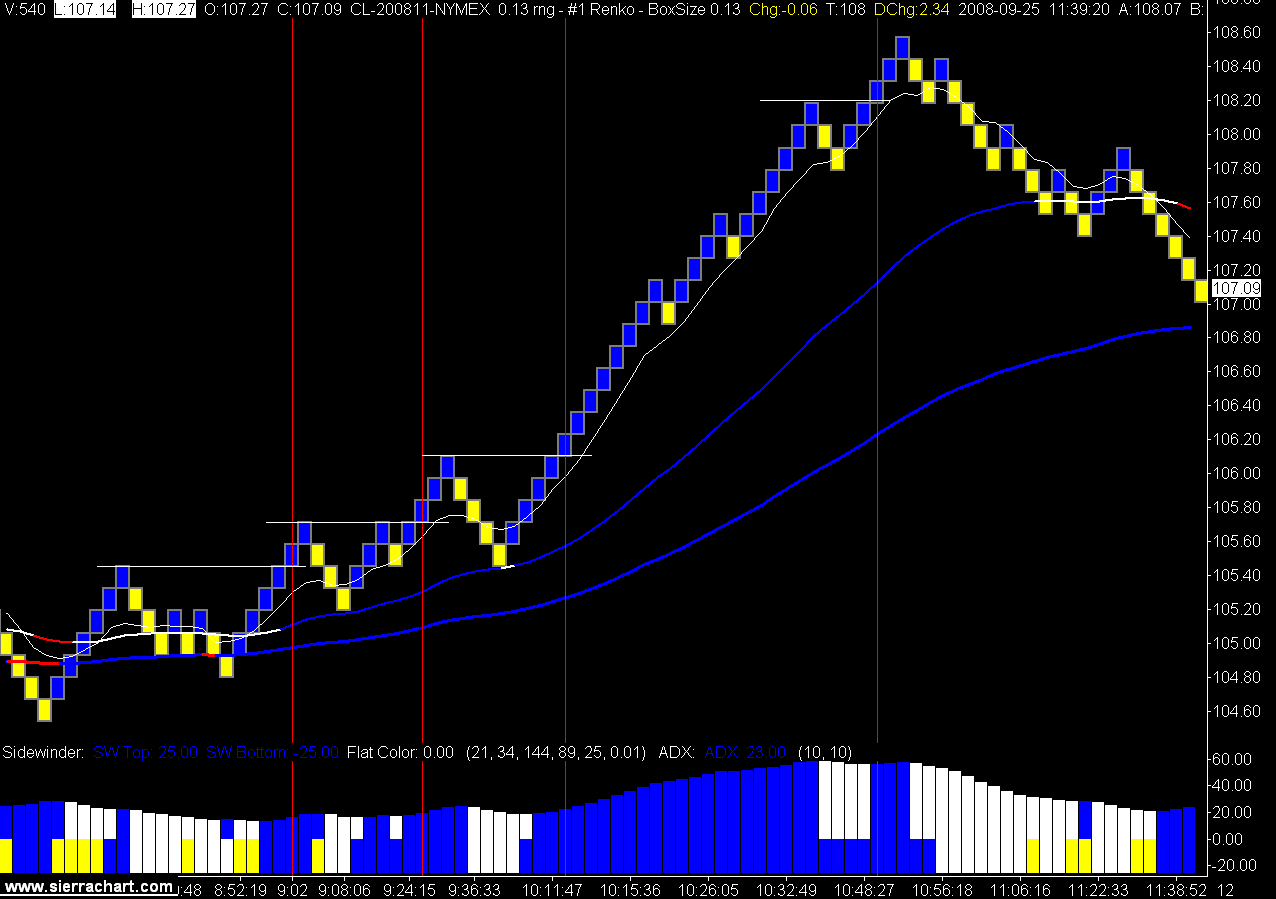
The day started out very slow and I got a little anxious and took a trade before the EMAs were all on the right side of each other. Fortunately I got a break even on that one and then next one exploded to the upside.
The Renko bars called the top of trade and I got out with the ADX color change.
Nice day to trade crude oil.
13 Tick Renko Crude Oil Chart (click to view)

The Renko bars called the top of trade and I got out with the ADX color change.
Nice day to trade crude oil.
13 Tick Renko Crude Oil Chart (click to view)

8/12/2008
Trading the Plan, Even if it Hurts
Only 2 signals today, which is a good thing as I would rather trade less than more.
Both signals were clear, both signals had nice follow through, and I lost money on both signals.
The 12 tick stops were not wide enough to keep me in and I do not try and re enter until that move is over. In other words I have to wait for a new signal. This rule is in place to keep me out of my revenge trading mode.
That's they way it is with trading, sometimes it's all there and you don't get anything but pain. Which is why people change their plan over and over. I will just show up for work tomorrow and do the same thing.
13 Tick Renko Bar Crude Oil Chart (click on chart to view)

Both signals were clear, both signals had nice follow through, and I lost money on both signals.
The 12 tick stops were not wide enough to keep me in and I do not try and re enter until that move is over. In other words I have to wait for a new signal. This rule is in place to keep me out of my revenge trading mode.
That's they way it is with trading, sometimes it's all there and you don't get anything but pain. Which is why people change their plan over and over. I will just show up for work tomorrow and do the same thing.
13 Tick Renko Bar Crude Oil Chart (click on chart to view)
8/11/2008
Crude Oil Down Again
These speculators simply must be stopped!
The price of oil keeps going down, who is to blame?
Ok, not very funny but you get the point. China's oil imports have dropped, American's gasoline consumption has dropped, it's as if economics actually work.
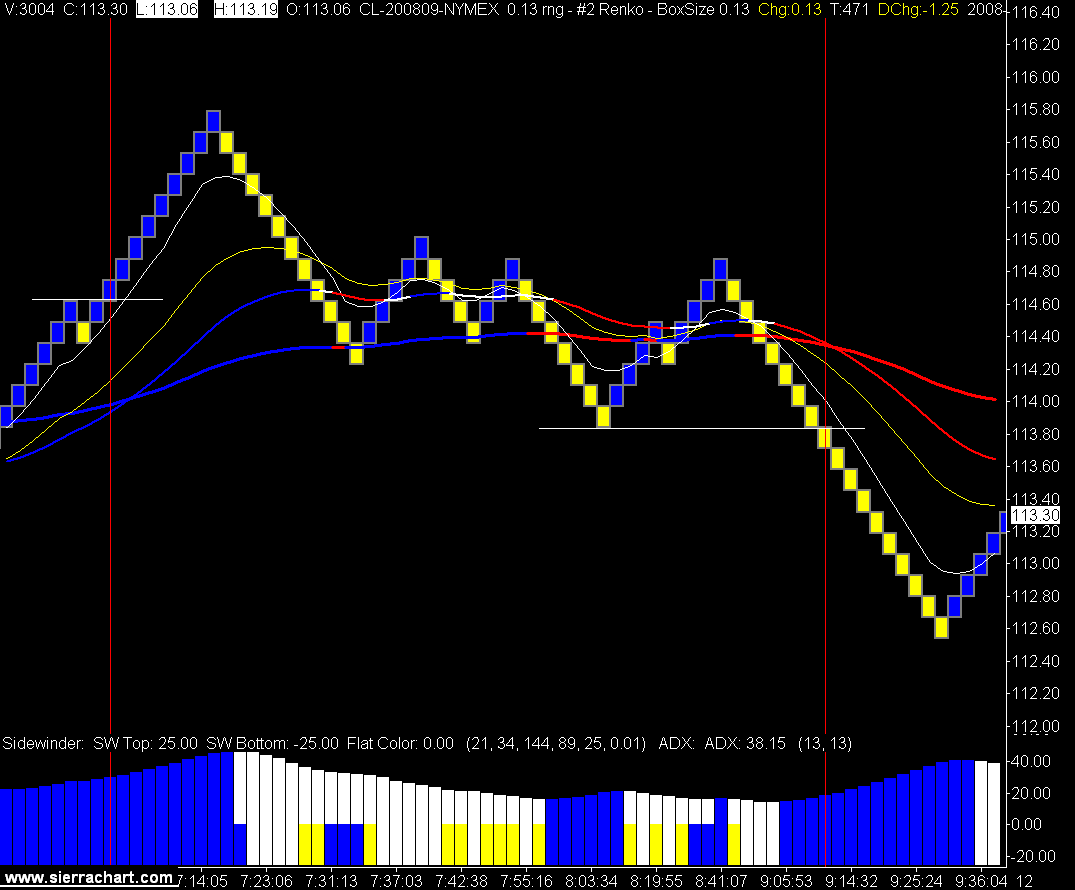
The trading day started out slow and then caught a nice downtrend. Four trades on the day: 1) small winner, 2) break even, 3) big winner, and 4) full stop out.
Trade the plan, trade the plan, trade the plan and when you're done that, trade the plan.
The renko bars are working nicely, they do a nice job of ignoring the chop and holding you in a trend longer than the plain range bars.
13 Tick Crude Oil Renko Bar Chart (click on chart to view)

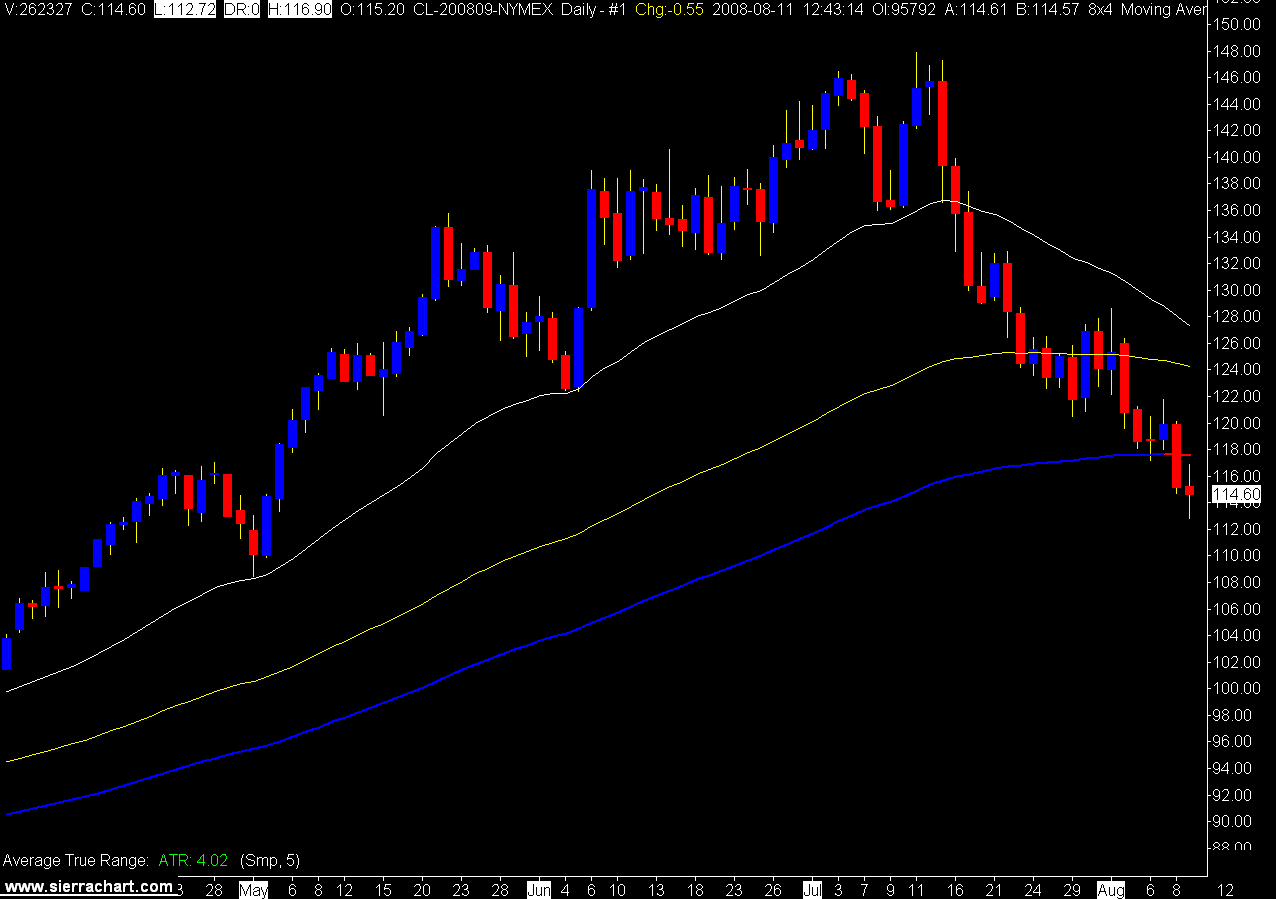
The daily crude oil chart has now broken free of the 144EMA, how low it will go is anybody's guess, $100 could be an interesting test.
Daily Crude Oil Chart

The price of oil keeps going down, who is to blame?
Ok, not very funny but you get the point. China's oil imports have dropped, American's gasoline consumption has dropped, it's as if economics actually work.
The trading day started out slow and then caught a nice downtrend. Four trades on the day: 1) small winner, 2) break even, 3) big winner, and 4) full stop out.
Trade the plan, trade the plan, trade the plan and when you're done that, trade the plan.
The renko bars are working nicely, they do a nice job of ignoring the chop and holding you in a trend longer than the plain range bars.
13 Tick Crude Oil Renko Bar Chart (click on chart to view)

The daily crude oil chart has now broken free of the 144EMA, how low it will go is anybody's guess, $100 could be an interesting test.
Daily Crude Oil Chart
Subscribe to:
Posts (Atom)