Showing posts with label YM chart. Show all posts

3/10/2009

A Tale of Two Charts

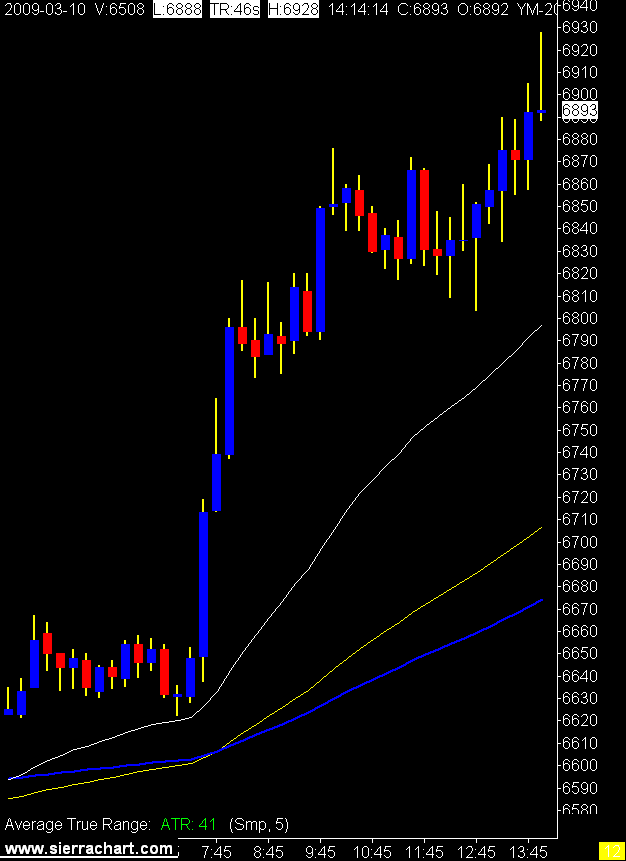
The Bull.

15 Minute Mini DOW Chart

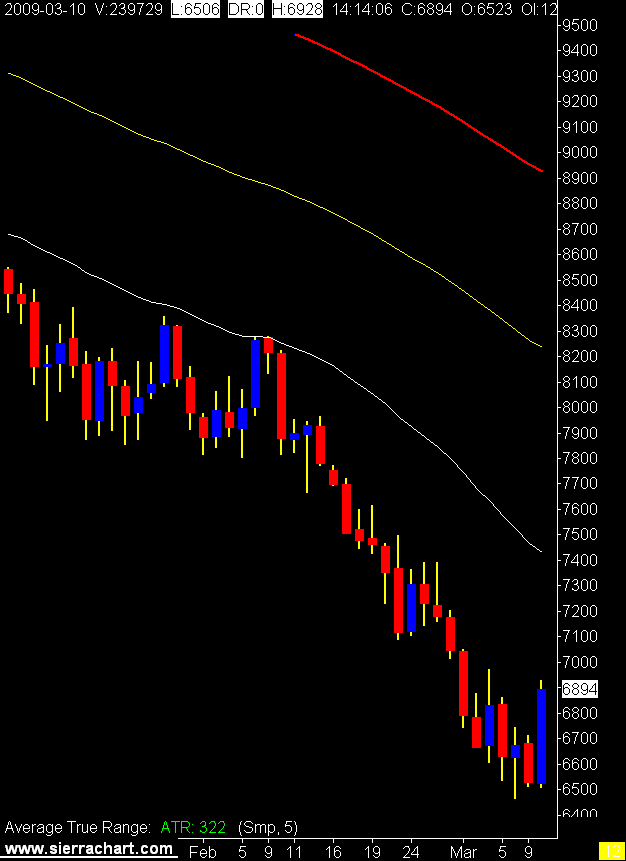
The Bear.

Daily Mini DOW Chart

Unless the DOW is going to zero it has to stop going down sometime.

Maybe this is that time?

Or not.

12/22/2008

There has been a sighting

And there was much rejoicing.

A blue bar! A blue bar!

Actually 3 on the 5 minute chart, that last one is after 4:00 EST. The 2 short trend bars did not line up with anything on the renko or 1 minute chart. The big blue long 5 minute bar set up nicely with the renko and a new swing high.

So we have 390 minutes of trading to watch each day, we spent 386 minutes doing nothing, 1 minute of trading, and 3 minutes of joyous celebration.

Another exciting day in the life of a day trader.

5 Minute YM Chart
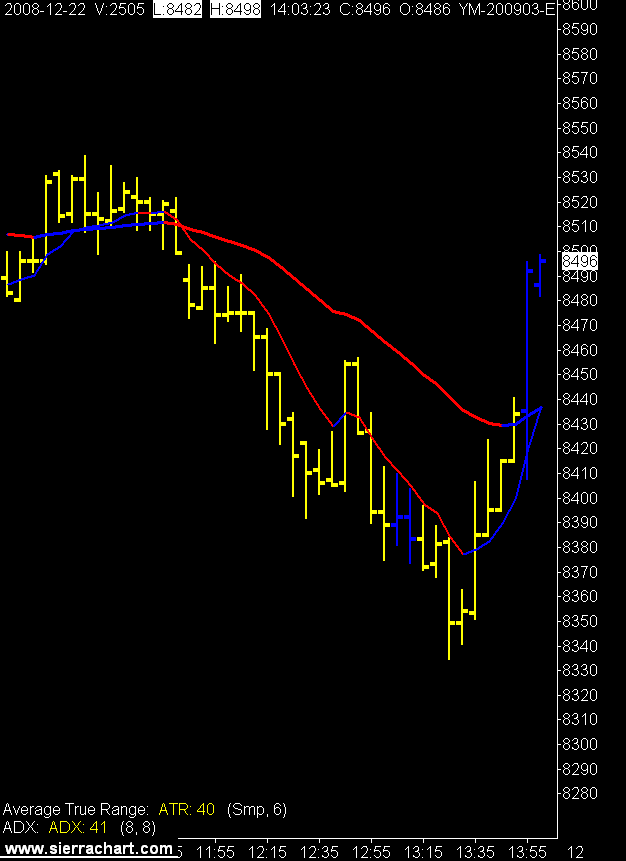
8 Tic Renko YM Chart

10/30/2008

My Ugly Chart

Now that's an ugly chart.

15 Minute Mini DOW Futures Chart

The last full 15 minute bar looks good. Other than that it was a mess for me. My daily stop (question #7) kept the pain to a tolerable level.

5 trades today, 4 losers and 1 break even, 1 lonely winning tick / 43 losing ticks = RR 0.02.

We live to trade another day.