8/29/2009

'Over a Barrel, The Truth About Oil'

Interesting story from ABC News 20/20 on America and oil.
(volume is low, so turn it up)

They love to bash speculators and have some interesting things to say about us. To me, a speculator, the story moves to an opinion rather than the "truth about oil" at that point. Every commodity is traded many times over before it hits the consumer, oil just happens to be the most important and is non renewable. Hence over the next 50 years or so price will continue to go up unless some viable alternative to it is found.

If you are in the U.S. you can watch it here.


They brush over the American source of "friendly" oil, namely Canada. I wonder what percentage of Americans know that Canada supplies them with more than double the petroleum than any other country?

American Petroleum Imports
Crude Oil and Total Petroleum Imports Top 15 Countries
June 2009 Import Highlights: August 28, 2009
Monthly data on the origins of crude oil imports in June 2009 has been released and it shows that three countries exported more than 1.00 million barrels per day to the United States (see table below). The top five exporting countries accounted for 64 percent of United States crude oil imports in June while the top ten sources accounted for approximately 82 percent of all U.S. crude oil imports. The top sources of US crude oil imports for June were Canada (2.001 million barrels per day), Venezuela (1.119 million barrels per day), Mexico (1.099 million barrels per day), Saudi Arabia (0.902 million barrels per day), and Nigeria (0.769 million barrels per day). The rest of the top ten sources, in order, were Angola (0.435 million barrels per day), Iraq (0.374 million barrels per day), Russia (0.305 million barrels per day), Columbia (0.286 million barrels per day), and Brazil (0.269 million barrels per day). Total crude oil imports averaged 9.172 million barrels per day in June, which is an increase of (0.241) million barrels per day from May 2009.

Canada remained the largest exporter of total petroleum in June, exporting 2.529 million barrels per day to the United States, which is an increase from last month (2.206 thousand barrels per day). The second largest exporter of total petroleum was Venezuela with 1.237 million barrels per day.

Total Imports of Petroleum (Top 15 Countries)
(Thousand Barrels per Day)
Country YTD 2009
CANADA 2,417
VENEZUELA 1,180
MEXICO 1,274
SAUDI ARABIA 1,084
NIGERIA 679
RUSSIA 638
ALGERIA 484
ANGOLA 547
IRAQ 471
COLOMBIA 283
BRAZIL 356
UNITED KINGDOM 262
VIRGIN ISLANDS 306
KUWAIT 174
NORWAY 136

Source: U.S. Government, Department of Energy, Energy Information Administration

8/27/2009

The Swami Speaketh

I find you odd.

Yes, you.

You never know what kind of post topic is going to push trader's buttons, so to speak. Jules said I was sounding swami like with my previous post. The EIT (exceptional Irish trader) had told me the same thing after he read that post. Ok he actually called me guru like.

I found this all rather offensive as I thought I had just posted a blog stating that I don't want to be your guru.

Maybe I do?

No

I don't.

I thought my point about what market do you trade was important. I still do. I think it's very important. In fact I think it is the most important factor after money management. So I offered what I thought was a very simple way to gauge different markets in order to see if there might be something else out there that you could trade. There may be something better than crude oil, if so let me know. Crude isn't always the best thing to trade as there are many posts on this blog with me whining about the lack of signals on crude oil.

Anyway I thought it was important but I get the feeling that you don't. Maybe I didn't say it right, or maybe I sounded too swami like. If so I apologize.

What if all our plans, technical analysis, indicators, systems, didn't matter? What if the only thing that mattered was a market that will get in a trend and stay there for a while? If that were the case, or at least partially the case then maybe we should take a little time and examine the different products there are to trade. Maybe we should spend more time on that rather than hours of studying whether a 34 EMA is better than a 21 EMA?

You can look at daily or hourly charts with the ATR as a guide to quantify the products range. It doesn't really matter how you measure as long as you apply the same measurement to all the markets you want to look at.

That leads me to another point, the market you want to look at. People seem hesitant to look at something else, they get very attached to their market and they don't want to leave it. I know I am the same way, slow to change.

You don't have to change, just look. Measure a few different markets and if something jumps out at you sim trade it for a while. Yes the power of sim, you don't have to dive into the crude oil pit head first (oops I let that crude bias slip out there) you can sim trade.

Why not?

Since I'm wagging crude's tail today have a look at the chart. I know, I know, you're saying, will he just shut up and post some charts!

Fine, be that way and since I am not your Swamiguru you can just look at the shiny chart and forget everything I said. :)

2 Minute Crude Oil Chart
I took the first two and passed on the last two.

8/25/2009

Is it the market or me?

What makes a system perform better some days or weeks than other times? Is it the trader or the market? It can be both but let's assume the trader has his head on straight and is functioning as he should. Maybe I should say she if we are talking about a functional trader. :)

If the trader is on her game then the only other variable is the market. We trade the same system every day but we trade it in market conditions that change every day. The eternal question is, has the market changed so dramatically that my system doesn't work anymore? I think the answer is yes and no. The market may have changed to the point where your system doesn't work as well as it once did, but the market will change again and your system will work again.

What to do?

Risk management rides to the rescue again. Remember we are assuming the trader is following the rules, so the risk management rules should keep you whole until the market returns to "normal".

There is one other thing we can do besides sit on the sidelines. We can trade multiple markets. I am currently trading crude oil, soybeans, and Russell 2000 futures, but I don't trade all of them every day. In June soybeans were the gift that gave every day, in July and August they have been terrible. Crude oil has been moving nicely and the Russell has its moments as well.

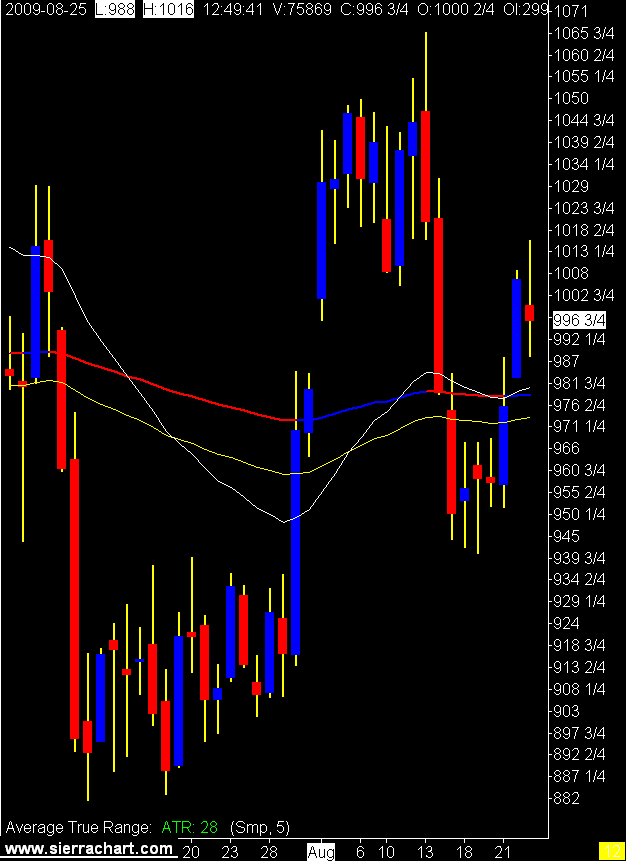
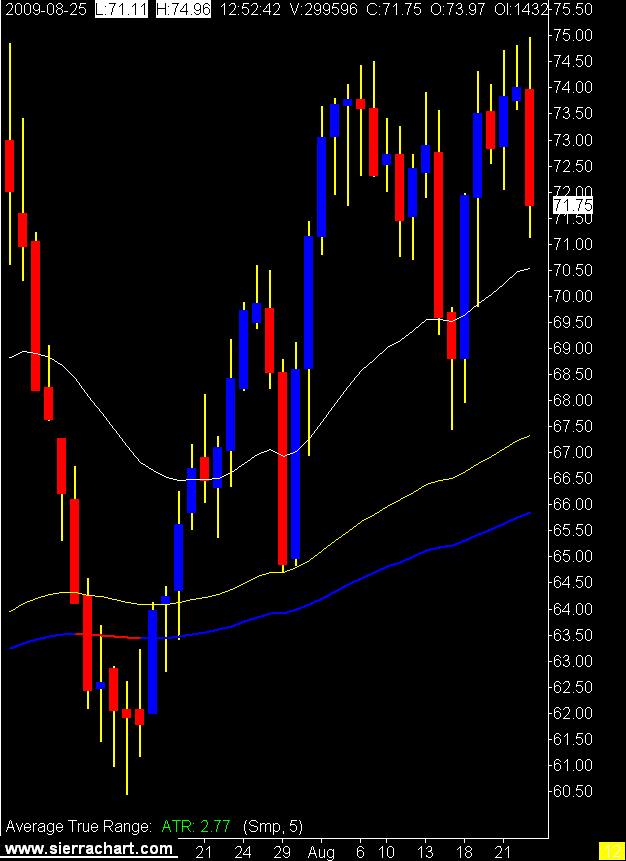
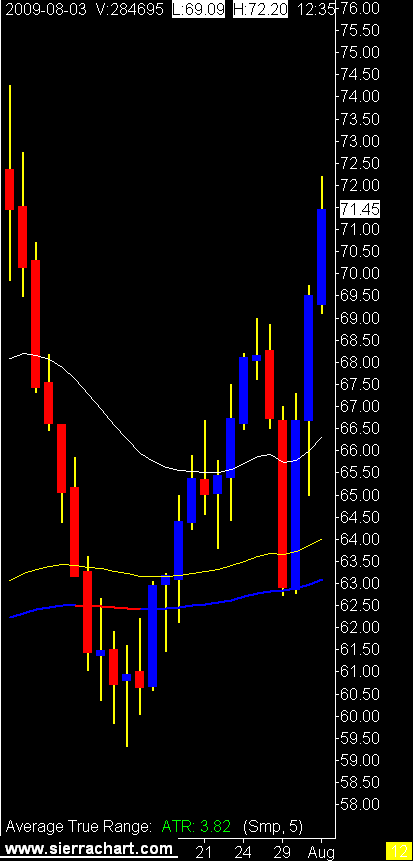
How do you tell if your market is moving? Yes I know you look at it. But is there some math we can apply? For me the ATR (average true range) is a nice guide. Below you see 3 daily charts of the markets I trade. You can see that soybeans keep going flat with crude and the Russell in a nicer trend. You can see that now, looking backwards, as always it's a little harder when it’s actually happening or more precisely when the market conditions are actually changing.

I use a 5 period ATR (5 days average true range) to give me a number. If you track that number, or watch the line, you are given an absolute value of how your market is performing in terms of range.

You need to understand what the ATR number means in ticks for your product. As we are trying to take a little meat out of the middle of the market the larger the sandwich, the easier it is to find that middle. If that makes any sense. :)
So for me, the product with the largest range is the best one to day trade.

Try it and see if it has any value for you.

Daily Russell 2000 Chart
Daily Soybean ChartDaily Crude Oil Chart From these charts you see that the Russell's ATR in ticks is 136, soybeans 112, and crude oil at 277.

For my way of thinking and trading, crude is the man.

8/24/2009

Are Great Traders Born or Taught?

The whole turtle trader experiment was done to answer that question, nature vs nurture. The prevailing answer seems to be it can be taught as most of the traders succeeded in the experiment. However when you read about the traders from that test, the majority failed after they left the tutelage of Richard Dennis and William Eckhardt and tried trading on their own.

I think it can be taught but not everyone has the mind set, or the nature, to succeed in this business. It is a strange business.

How about guitar players? Could this be taught?


I wish I could do that.

I think I could take lessons and practice for years and never be able to play the guitar like those two guys. My uncle can play the guitar and banjo and has never had a lesson in his life. He just listens to the music and then plays it. How can that be? Think about that, it's crazy.

So we know that trading and music can be taught and if you practice enough you may become good. But can you truly become great, or is greatness determined by our genetics?

Hmmmm.

Way of the Turtle: The Secret Methods that Turned Ordinary People into Legendary Traders

The Complete TurtleTrader: The Legend, the Lessons, the Results

8/20/2009

Bloggeritis

Trader Bloggeritis: a common malady recognized by the patient’s incoherent ramblings about ox entrails and other technical indicators.

When I stopped blogging in March I said I wasn't sure what I wanted to do with this thing and wouldn't start writing again until I was sure.

Well I started again in June without any clear direction of what I wanted to do with the blog. I know what I don't want, I don't want to tell anyone how to trade.

I find that when I post charts of my trades I get people wanting to copy my methods, and as I have said many times that will not work for anyone. If you show charts of winning trades people think you are a genius, if you show charts of losing trades people think you are a moron.

Neither is true. I'm sure I fall somewhere in between those two walks of life. I'm happy with where my trading is at and I don't want to debate it, defend it, or glorify it. I'll just keep it to myself, thanks.

I love trading and find everything about this business fascinating. It appeals to my never ending curiosity about how business, economies, and capital markets work. There are so many moving parts that the quest to figure it all out is never ending.

The change is I am not going to post as often or as many charts as I did before. If I come across something that sheds some light on the subject, or if I have the occasional original thought I will post it. I will also post charts if there is a reason to post a chart, not just because another day is over.

I do enjoy the comments on the blog and it is my hope that the comments will increase in volume. As independent traders will live in an isolated work place and these types of forums are vital to keep us sane. Or to confirm we're insane.

To those who contribute regularly, thank you. To the silent majority, don't be so shy.

Solfest

8/19/2009

Know Thyself

So if the key to successful trading is all in my head then it would make sense to have some understanding of just what is going on inside my head. To long time readers this may be a frightening thought, but hey everyone likes to stare at car accidents so why not this.

I took the Myers Briggs personality test a couple of years ago and incorporated the results into a personality profile within my business plan. The idea being I wanted to see how my personality helps and or hurts my trading efforts. I think the result was somewhat useful and if you have not done this it may be worth the effort.

I'm not going to post any links to a Myers Briggs test due to copyright laws, you can do your own search and take it from there.

Here is the section from my business plan.

Personality Profile:

My individual strengths and weaknesses that will affect the emotional business of trading money are derived from my personality traits which have been described by the Myers Briggs Personality Profile as INTJ (Introverted Intuitive Thinking Judging).

“This personality type is described as the most self-confident of all the types, having "self power" awareness. Found in about 1 percent of the general population, the INTJs live in an introspective reality, focusing on possibilities, using thinking in the form of empirical logic, and preferring that events and people serve some positive use. Decisions come naturally to INTJs; once a decision is made, INTJs are at rest. INTJs look to the future rather than the past, and a word which captures the essence of INTJs is builder - a builder of systems and the applier of theoretical models.” David Keirsey & Marily Bates, Please Understand Me, Character and Temperament Types

“INTJs are perfectionists, with a seemingly endless capacity for improving upon anything that takes their interest. What prevents them from becoming chronically bogged down in this pursuit of perfection is the pragmatism so characteristic of the type: INTJs apply (often ruthlessly) the criterion "Does it work?" to everything from their own research efforts to the prevailing social norms. This in turn produces an unusual independence of mind, freeing the INTJ from the constraints of authority, convention, or sentiment for its own sake.” Marina M. Heiss

While I can see there are many INTJ attributes that are conducive to trading, the drive for perfection can be problematic as perfection in trading does not exist.

I have to be conscious of this and utilize statistical data to form truths that override my desire to never be wrong. In trading you can be wrong more often than right and yet still be very profitable if you stick to the plan. All trading plans will have a series of consecutive losing trades and as these trades stack up and I am “wrong” over and over my tendency is to want to abandon the plan and start the research process over again in the search for perfection. I have to consistently remind myself this pursuit is fruitless. I also must frame each losing trade based on was it a valid setup or not, did I follow the plan, or not. If the losing trade met the plan criteria then it’s a good trade.

In other words I was not “wrong” if I followed the plan. I can only be “wrong” when I fail to follow the plan.

This desire for perfection has manifested itself in my trading history with what is known as “revenge trading”. Revenge trading is re entering positions immediately after a trading stop out in order to prove that I was right in the first place. This is why I have programmed rules about when I can take another position after a stop out, to stop any random revenge trades.

Under extreme stress, fatigue or illness these characteristics can appear in an INTJ:

• doing things to excess - e.g.: eating, drinking or exercising
• acting very impulsively, perhaps starting off more projects than the INTJ could hope to accomplish
• expressing emotions in an intensive and uncontrolled way
• being very sensitive to criticism
• asking for lots of information that is irrelevant

Summary – INTJ

Contributions to the Organization
• Provide strong conceptual and design skills
• Organize ideas into action plans
• Work to remove all obstacles to goal attainment
• Have strong visions of what the organization can be
• Push the organization to understand the system as a whole with its complex interaction among parts

Leadership Style
• Drive themselves and others to attain the organization's goals
• Act strongly and forcefully in the field of ideas
• Can be tough-minded with others
• Conceptualize, design, and build new models
• Are willing to relentlessly reorganize the whole system when necessary

Preferred Work Environment
• Contains decisive, intellectually challenging people focused on implementing long-range visions
• Allows privacy for reflection
• Efficient
• Includes effective and productive people
• Encourages and supports autonomy
• Opportunities for creativity
• Task-focused

Potential Pitfalls
• May appear so unyielding that others are afraid to approach or challenge them
• May criticize others in their striving for the ideal
• May have difficulty letting go of impractical ideas
• May ignore the impact of their ideas or style on others

Suggestions for Development
• May need to solicit feedback and suggestions
• May need to learn how to appreciate others
• May need to learn when to give up an impractical idea
• May need to focus more on the impact of their ideas on people

8/17/2009

Interesting Chat

It was interesting because the CNBC talking heads pretty much kept their mouths shut.

I haven't read The Black Swan, if you have tell me what you thought of it.


8/16/2009

Whose Game are You Playing?

After a few years of trading I have come to the realization that the key to winning is all in my head. This is a psychological battle with myself. The market participants are irrelevant. There is no giant war against the big banks or hedge funds or you my fellow independents. The game (war sounds so nasty) is me against me. Or as I once penned Bad Solfest against Good Solfest.

I have an edge and the key to success is to only trade within that edge. Good Solfest follows that plan, Bad Solfest wants to make up new rules every time he has a losing trade. Bad Solfest tries to play everyone’s game, Good Solfest only wants to play his game.

Let me put this another way, wander over to your bookshelf and pick up your well thumbed copy of Trading in the Zone, by Mark Douglas. Douglas has a great analogy on page 102 about casinos. He states a casino has a 4.5% edge over all the players in the game of blackjack. A small edge. The casino is very confident in their edge, they don't question it, they don't get concerned if they lose money to some players. They know they have an edge and if the game is played by their rules they will win in the long run. How do they know this? They have stats, millions and millions of games played.

They know.

If someone comes into their house and tries to change the rules (they call it cheating) they take them into a room with no windows and break their kneecaps. That's how we know if we want to play we have to play by their rules. We also know that if we play enough we will lose and they will win. Why people play a game with that reality is beyond me. Or is it the same reason people keep trading even though they are losing money every month?

The successful trader has to be "the house". The game has to be yours not someone else’s. It's your game because you set the rules, your plan is the rule book, and you have set the standards for the game.

There are two issues that must be done right in order for your "casino" to be profitable, your plan must have an edge and you must never deviate from the plan.

How do you know what your edge is? Stats, stats, and more stats. It's all you have; it's the only way to know. Do you have them? If you don't have the stats to back up your plan and you are trading live you are a dead man. You are not the casino, you are the drunk tourist from Hoboken, and let me repeat, you are a dead man.

Get the simulator out of the closet and get yourself a database of trades that means something. If the edge is not there with the current plan you have some work to do.

Now let's assume the stats are there, the edge is solid, now all you have to do is execute. Why is that so hard? Recency bias? We humans are stupid? No, no that's a little harsh, we're just emotional, and the emotions that come roaring out when we are dealing with money are ego, fear, and greed.

How do we combat these emotions? How do we act like the casino with the small edge? We keep our stats and we measure our success based on something other than money.

We know what we have to do, so let's measure our success on how well we do it. It’s our game and we keep the score. The game is not scored by profit or loss but by how many plan certified trades you take. You lose points by missing qualified trades and by taking muts (made up trades).

You can figure out the scoreboard any way you want along those lines. Make adherence to the plan the only thing that matters.

You are the house, the casino, so when you let the other players into your establishment make sure you only play against them by your rules.

If you cheat (don't play by your own rules) I will come to your house, take you into a windowless room and break your kneecaps.

Trading in the Zone: Master the Market with Confidence, Discipline and a Winning Attitude

8/13/2009

On The Brighter Side

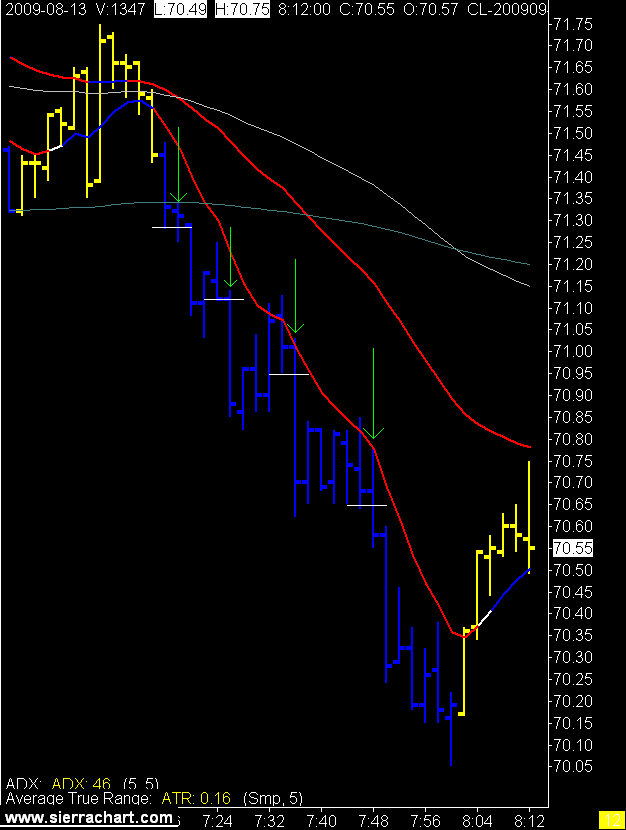
Crude had a nice move down this morning.

2 Minute Crude Oil Chart

Just so you know that life is ok in our world I present to you a photogenic squirrel and a heroic piano player.

Some Things in Life are Free

Isn't that a line from a Beatles song? I better check.


Ah yes it's "the best things in life are free", indeed they are.

Unfortunately the day trading business doesn't always bring out the best people in life. If you want to learn how to trade pretty much everything you need to know is free. The online resources are massive and there is no need to pay anyone for anything. Now books, well they cost money and for me I think most of them are worth it. Of course there's also this long forgotten thing called a library where you get to read the books for free. :)

Why do I bring this up you say?

I found another blog quoting my Why You Should Not be a Trader post. Unlike another guy that the Lonely Trader has been exposing this blog followed proper blogging etiquette and provided a link to my blog and gave me credit for the post. The problems start as their blog is a portal for several paid day trading services. That in itself doesn't bother me as it's a free country and they can do what they want. That said I'm not linking to them or saying the name as I don't want anyone going there.

The huge problem I have with them is they are using God as a, hmmm I don't even know what to call it. Let's just say that they give the appearance that their services are God approved. They are trading for Jesus so to speak, or taking your monthly fee for Jesus. This crosses a line so wide I have trouble defining it. Let me share a couple of verses with you that explain it rather well.

Don't just read these words, play out this scenario in your head, what it would have looked and sounded like.

Jesus entered the temple area and drove out all who were buying and selling there. He overturned the tables of the money changers and the benches of those selling doves. "It is written," he said to them, "'My house will be called a house of prayer,' but you are making it a 'den of robbers.'" Matthew 21: 12-13

I'm no biblical scholar but I don't think there are any other examples in the Bible where Jesus gets angry. I mean really angry, shouting, shoving, loud, wild anger.
So as you may have guessed this bothers me. The day trading business is a dirty one as there are desperate people and newbies who can get sucked into paying someone who has the appearance of success. There is simply no way you can know if anyone really is a successful trader. Including me, for all you know I am sim trading from prison.

So the message is never pay for any kind of advice in this business. Buy some books, take advantage of all the free online information and do the work required. There are no short cuts and that's what these guys are trying to sell you, a short cut.

I have spent 14 years studying the markets, investing, and trading. I have taken all the courses required to be a broker in Canada. I have read well over 100 books on the subject. I have done the work and the work is ongoing. After all that I'm still learning, I'm not "there" yet. Even with all that work in the bank you still are not a trader until you spend thousands of hours in front of the screens.

The point is it's a long hard journey and if you're not prepared to do the work then quit now.

Sorry for the long rant, but "they" got me going.

Peace.

8/12/2009

Wake up, Drink coffee, Open charts...

This is a great job. Trading. Every day provides something different, just when you think you know what to expect the unexpected happens. That's why biases will kill you in this business.

You have to start each day with a clean slate, no opinions required. In fact your opinions about what the market is going to do today will only get in your way. The market is going to do what it wants to do, and it doesn't care about your opinion.

That's why I love day trading. Each morning you venture out into the pit and at the end of the day you count your money, put it back in the bank, then go home and forget about it. Tomorrow is another day, and it has nothing to do with what happened today.

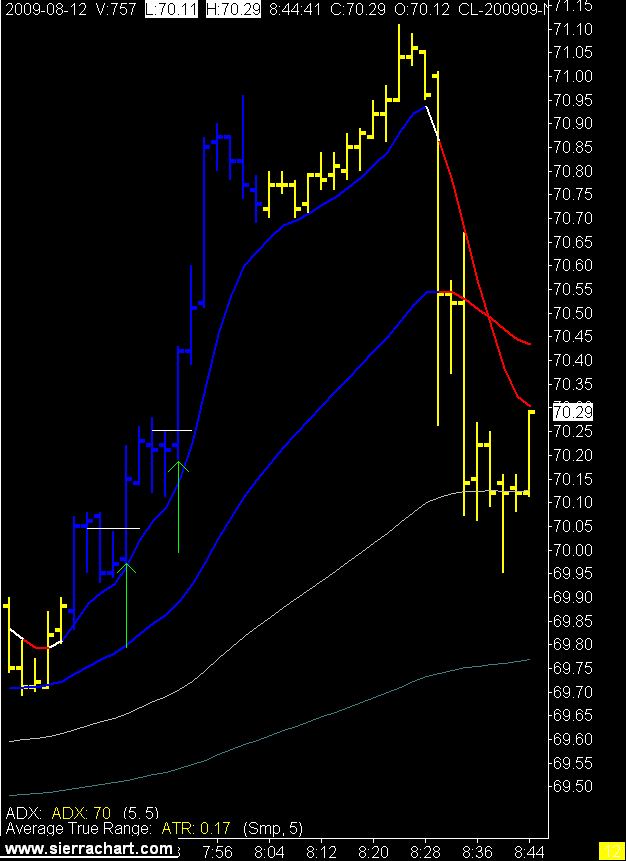
Speaking of which we had the crude oil inventory report today. That report comes out at 8:30 my time (MST) and there usually is not much action in the morning before the report.

Usually.

Today for whatever reason all the crude action happened before the report. Don't know why and don't really care. It just did.

Tomorrow something else will happen, don't know what, don't care why, I just watch the chart and do what it tells me.

Most of the time. :)

2 Minute Crude Oil Chart

8/11/2009

Beautiful

2 Minute Crude Oil Chart
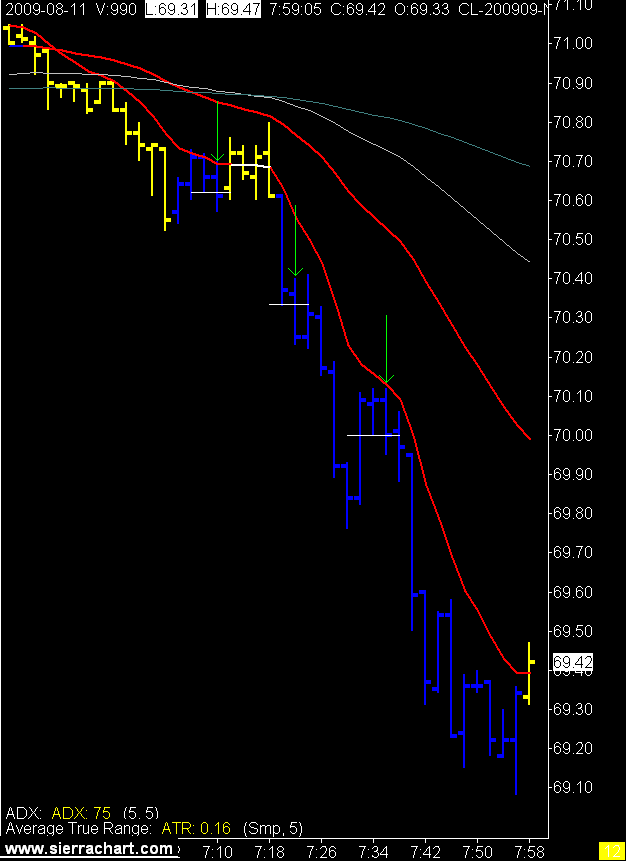
Those are some nice signals. Right? The first one was a stop out but the other 2 are things of beauty. Right? Solfest the "genius" must be counting his crude dollars. Right?

Wrong.

What happened? Remember how smart you were yesterday. Yes I do. In fact that was the problem. Recency bias reared its ugly head yet again, recency bias, we place more meaning on the most recent events rather than our historical results. Remember yesterday I was bragging about my brilliant reading of the ADX. So did the ADX let you down today you ask?

No. The ADX levels were through the roof. The problem was I didn't take it in. I saw it but I traded like I did yesterday. I moved stops too soon today. In yesterday's weak trend that was the right move, but today, in the monster trend the thing to do was hit the entry button and let the pre programmed stops do there thing.

I didn't do that. I let my "recent" success from yesterday cloud my decision making today. Result being I hit my daily stop and had to shut it down.

Trading is hard. :)

8/10/2009

A Trend is.....

A trend is defined as.... what?

A continual move in one direction. For how long? How steep? How fast?

You get the point, everyone (well almost) wants to trade with the trend but everyone would probably call the trend differently. The big monster moves are easy to see, at least once they've happened they're easy to see.

That's the trick, we trade the "hard right edge" of the chart. All gurus and system salesmen can point to their perfect entry points on a static chart, but try trading it live.

The point of this post, if there is one, is why do I use so many different, or redundant depending on your view, indicators. Sometimes I wonder myself. I had the CCI programmed into my blue bars for a while and then discovered that every signal I had happened with or without my CCI criteria. In other words, for me, the CCI was a redundant indicator so I got rid of it.

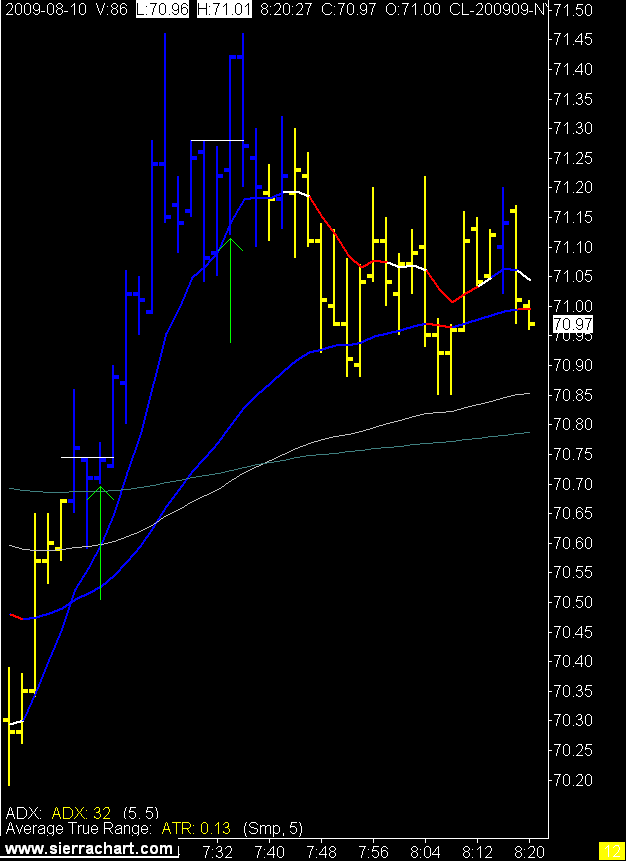
Today was a strange day in crude oil as there was lots of volume and some nice moves but everything seemed to happen in slow motion. The indicator that picked that up the best today was the ADX. The ADX is the one indicator that I have sometimes wondered about, wondered if it was redundant for me.

Tis not.

It also got me wondering what the heck is it. Gasp you say. He doesn't know, I'm getting a new guru!

Well I'm not your guru and I have the definition written down in my plan but as I sit here I can't really remember what it is. J Welles Wilder invented it, along with the ATR and many others. I still haven't looked now, from what I remember it is just an average of Wilder's DMI lines. Hmmm that does beg another question now doesn't it.

Ok I'll look it up, back in a sec.

Read it for yourself. Read some more here.

I pretty much knew all that, still not sure what the DMI lines are, moving averages of some sort I guess.

Anyway the ADX worked well today and either kept me flat or warned me to tighten stops. I say it was the ADX today because the other indicators looked strong at times. ATR wasn't through the roof but was there, the EMAs had good angles, just the ADX said, wait a tic here boss.

I listened and the day was positive. One good trade, one stop, and many break evens.

2 Minute CL Chart

8/06/2009

Bah!

Humbug

What a mess, took the longs, missed the shorts, done for the day. We're off on a little trip so may not trade tomorrow.

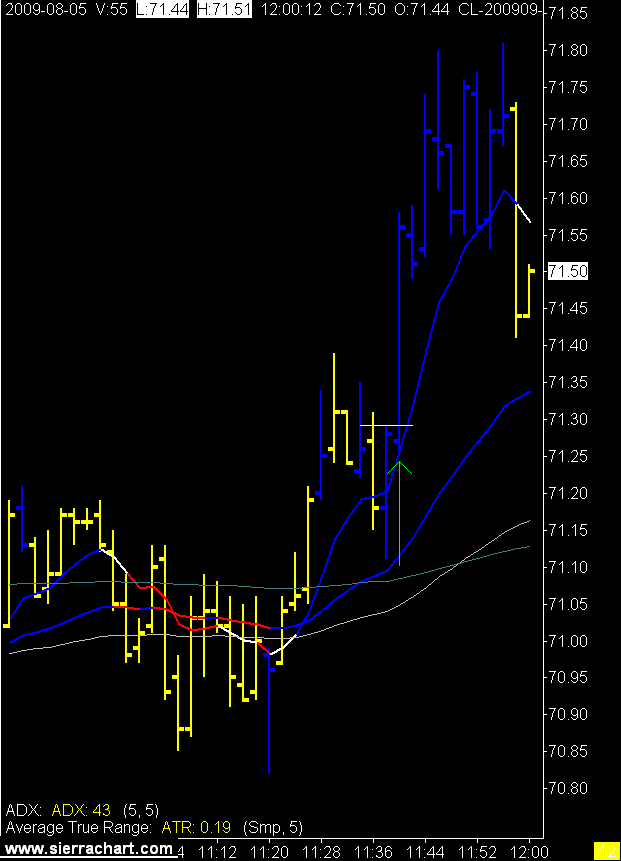
2 Minute Crude Oil Chart
On another note China may have found the cure for all the investment fraud we have seen in North America lately.

8/05/2009

Who Am I

If I'm the "weakened animal" Satyajit Das is talking about in Traders Guns & Money then I guess I'm ok with it. Although I could be the hyena, no let the institutional traders be hyenas, I'll be the wolf.

The reality is I'm too small a trader for anyone to notice, and that's just fine by me. I'm not leading the market, I'm following. Unfortunately that does make me look more like a hyena then a wolf.

Oh well.

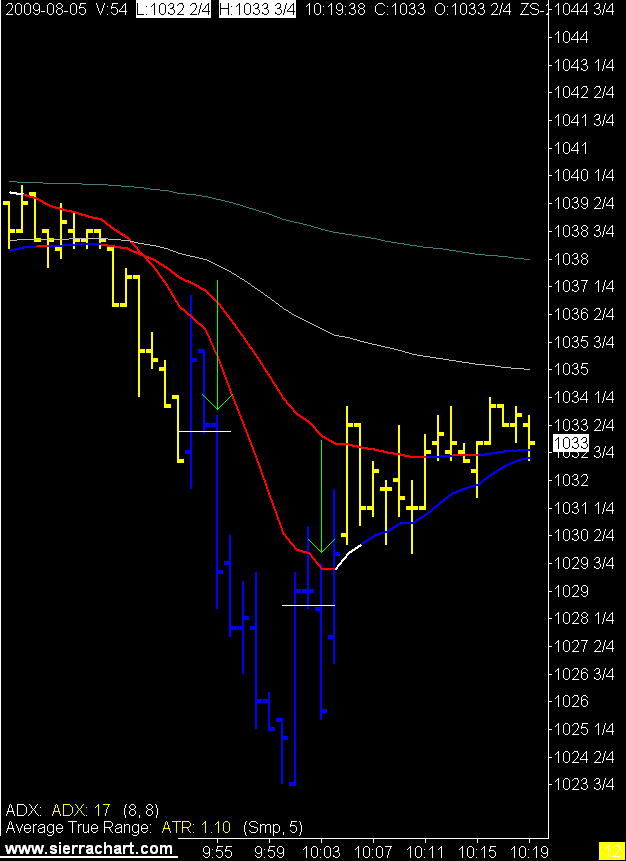
1 Minute Soybean Charts

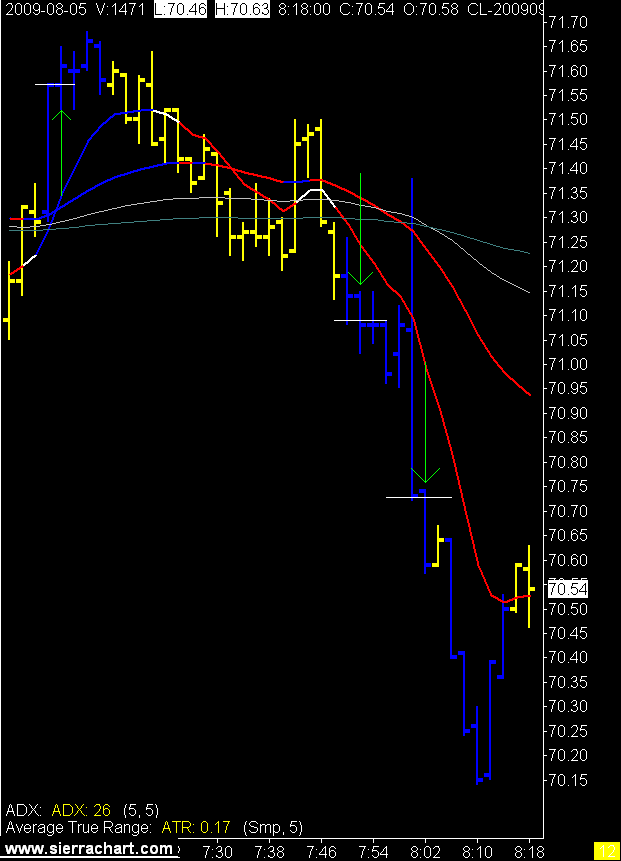
2 Minute Crude Oil Charts

'Beautiful Lies'

I am currently reading Satyajit Das's book, Traders Guns & Money. I'm loving it and find myself continually laughing out loud.

The back cover of the book describes it as "a wry and wickedly comic expose of the culture, games, and pure deceptions played out every day in trading rooms around the world, usually with other peoples money".

Here are a few samples.

"Beautiful lies' are the lies that we like to believe; we know they are not true but everything makes us want to believe them - that is what makes them beautiful.

I used to be responsible for showing the trainees around the trading floor. 'Look, it's quite simple, I said, breaking down the hierarchy of the trading floor. 'There are salespeople - they lie to clients. Traders lie to sales and to risk managers. Risk managers? They lie to the people who run the place - correction, think they run the place. The people who run the place lie to shareholders and regulators.' I remembered our quantitative colleagues. 'I forgot the quants - our fabulous rocket scientists! When last heard from, they were trying to develop a model for lying.'
'And clients?' one of the trainees asked tentatively. I thought about it for a few seconds. 'Clients. They lie mainly to themselves!' To enter the world of derivatives trading is to enter a realm of beautiful lies.

There is only one way to make money - you buy low and sell high. Sorry, forgot the second rule - sell high, buy low. Listening to traders you get an entirely different view of their business, especially its complexity.

Some traders engage in elaborate analysis of market forces. There is technical analysis consisting of trying to find patterns in price movements over time, there are head and shoulders, rising and falling pennants, retracement points, resistance lines, oscillation indexes, RSI (relative strength indicators, not repetitive strain injury). There are more arcane techniques - Elliot waves, Fibonacci series, Japanese candle stick techniques. The list is endless. It is a modern version of reading the entrails of a slaughtered ox.

Success in trading relies on on simple rules. Overwhelming force is generally good - you just have more money than everybody else and can hang on until everybody is forced out of the game. Ganging up is effective - you just get together with other traders and fall upon a weakened animal like hyenas or wolves. Ambush is also good - you know something that the other guy does not know, at least not yet. Flow traders are well versed in ambush. It also helps to be lucky - better to be a lucky fool than an unlucky genius." Satyajit Das, Traders Guns & Money
Traders, Guns & Money: Knowns and unknowns in the dazzling world of derivatives

I believe we, the independent traders, are the weakened animal that the institutional hyenas devour.

The line about technical analysis being the "modern version of reading the entrails of a slaughtered ox" is my favourite.

Of course that doesn't include my magic blue bars, right?

8/04/2009

Crude Rolls On

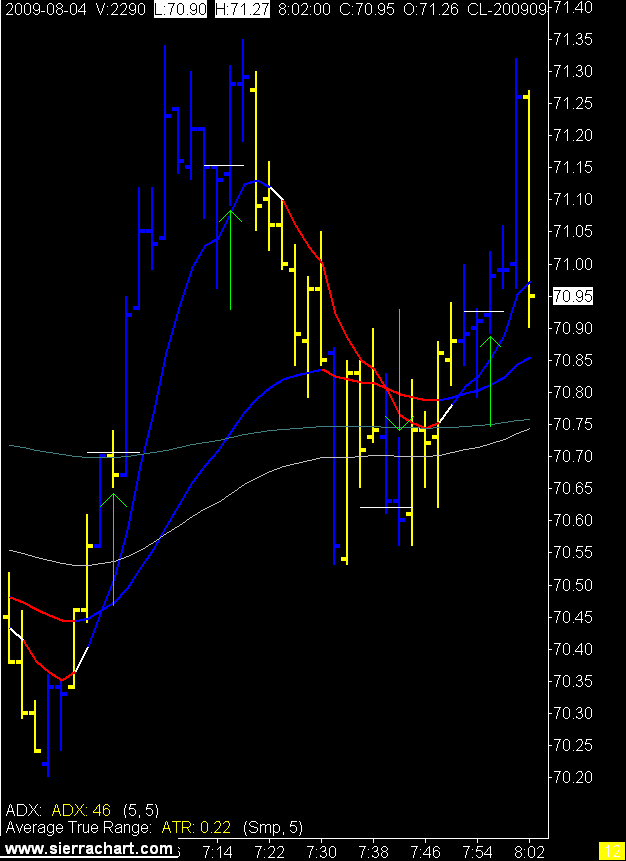
Crude is restoring my faith in things that go up and down and make shiny blue bars.

2 Minute Crude Oil Chart
The first trade's entry bar was blue when I entered and then went yellow as it closed under the EMA, still a valid signal and worked out to target. I should not have taken that third trade (short) as the short EMAs were still on top of the long EMAs, and I got smacked for my efforts.

Still a nice day.

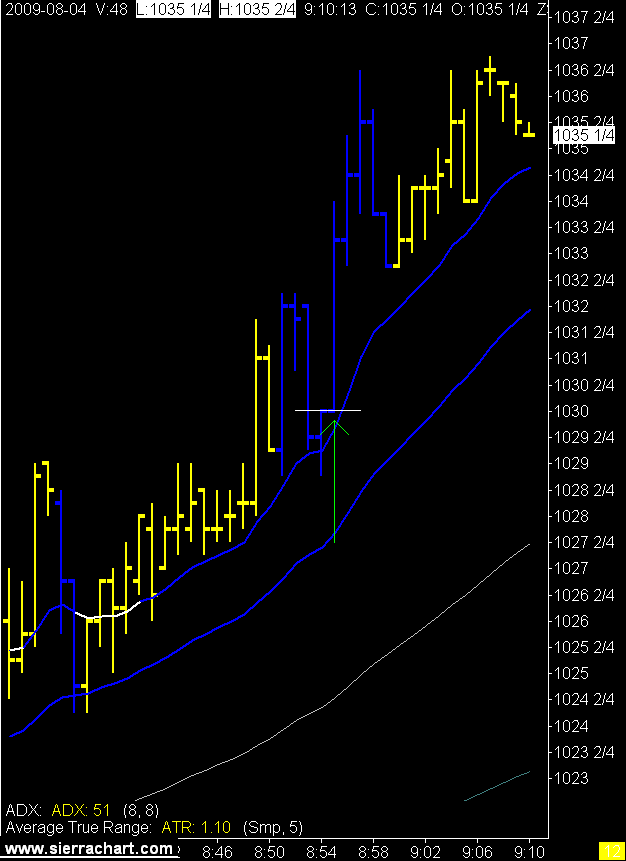
Soybeans were quiet again with one nice move that I didn't take as I was done after the early crude trading. This soybean chart can go in the business plan as the ultimate signal, we see the range expand, bars go blue, pull back to the EMA, break of previous bar high off the bounce, in we go, target we hit.

It could be the best trade set up I never took.

1 Minute Soybean Chart

8/03/2009

Renko Bars and Range Bars

WARNING: This post is very long and has no pictures. If this alarms you skip down to the next post which has few words and shiny pictures of charts.

Pandu the FX trader from Australia asked me this on an old post.

"I want to know what do you mean by 'The hard stop value is set as a % of the range bar we are trading.'. What is the meaning of 'Range Bar'? Also, what parameters do you use for the ADX you use?"

So that along with all the google searches for renko bar trading I get on this blog I thought I should take a moment and discuss why I quit using range bars and or renko bars.

In a word, time.

We all have access to the same data, we all live in the same space and time continuum. I heard that on Star Trek I think.

I don't move the market. I want to be looking at what most everyone else is looking at. Why? Because I'm going to ride along with whomever, collectively or all by themselves, does move the market.

So we're all looking at price move and we are all breaking down that price action with different methods. We have volume, time, and tick data and all of it tracks the same price but presents the trader bar closes in different ways. I want to look at the chart picture with the method, time, that I think most other traders are using. Note I said think, not know.

Of course everyone who uses one of those categories thinks it is the best. Until they change, just like I have. :)

Back to Pandu's question. The range bar measures a set range of price movements and when that range is met the bar prints.

A renko bar does the same except the range has to be all in one direction for the bar to print. So with a 10 tick renko bar the range has to be all up or all down for it to print. A 10 tick range bar could open at 70.25 and have 5 ticks up to 70.30 and 5 ticks down to 70.20 and the bar would print. A 10 tick renko bar would have to have 10 ticks up to 70.35 or 10 ticks down to 70.15 before it would print.
There are other little nuances to them both depending on your chart service but I'm not going into that here.

Got it? I hope so it exhausted me explaining it.

So the benefits to both are when price moves quickly the bars start printing. We need the bars to print in order for our indicators to, well, indicate. It may be a shock for some but all our indicators are lagging. Sorry. They need the price bars to move in order for them to do their "magic".

This all sounds good and works for many people, like the man who loves rain (Rainwater) and really wants to be included in Jules private blog but is too shy to ask. (Rainwater uses range bars not renko bars)

Actually it sounds so good it's making me wonder why I gave them up?

Renko, I gave up because there can be too much intra bar movement and it is too hard to find your way in with renko alone. I started using time charts with renko and then eventually just dumped the renko. Renko charts are great for keeping you in a trade and could be used for a technical exit, but then I started trading for a target rather than a technical exit so renko went bye bye.

Range bars are probably of more use but I found they gave me too many false starts and I need to control my pushy the button fingers.

I control them with time.

Time, I have to wait. I use 1 and 2 minute bars so I don't wait for long but for me, let me say again, for me, I find that time works the best.

Am I late sometimes? Yes. I give that up in order to stay out of some false moves.

So there it is, my trading still looks at range via the ATR, I need to see some movement in one direction via the ADX, I need price on the right side of the EMA's, I look for a higher high or lower low and away we go.

The longer multiple EMAs are there to simulate what a longer term chart would be showing in terms of trend and direction. Like a 5 and 15 minute chart or so.

This is a very long post with no pictures which may be alarming to some. I better place a warning at the top of this post.

Oh yes the rest of Pandu's questions. My stop on the range or renko bar was a % of the bar I was using. So for a 20 tick range bar I may use 75% of that as a stop, 15 ticks. With the ADX and ATR I am looking for a minimum threshold to be met before I start looking for signals. That's all.

P.S. Those renko bar charts were sure pretty.

Home

The World Was Flat

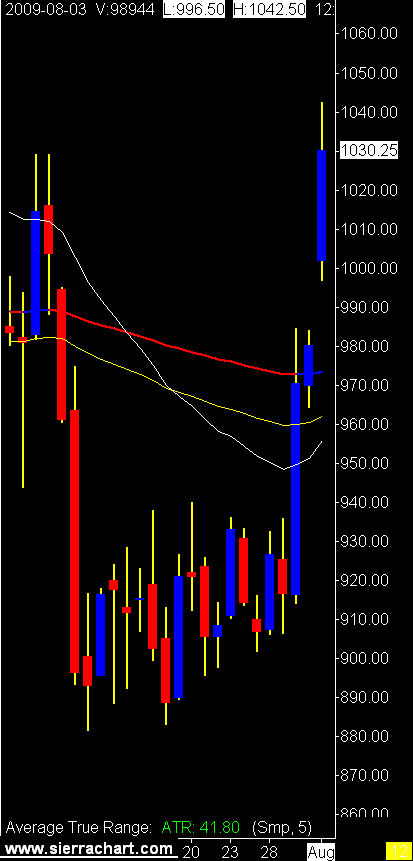
I was complaining that soybeans had not offered much to trade in July. Looking at the daily chart for July you can see why. When the world is flat stay on the beach.

Daily Soybean Chart
Crude on the other hand has been anything but flat and the opportunities to trade intraday have been plentiful.

Daily Crude Oil Chart
The message is, listen carefully now the guru is speaking, trade the bumpy chart not the flat one.