9/30/2008

Now We Wait

Daily Crude Oil Chart (click on chart to view)

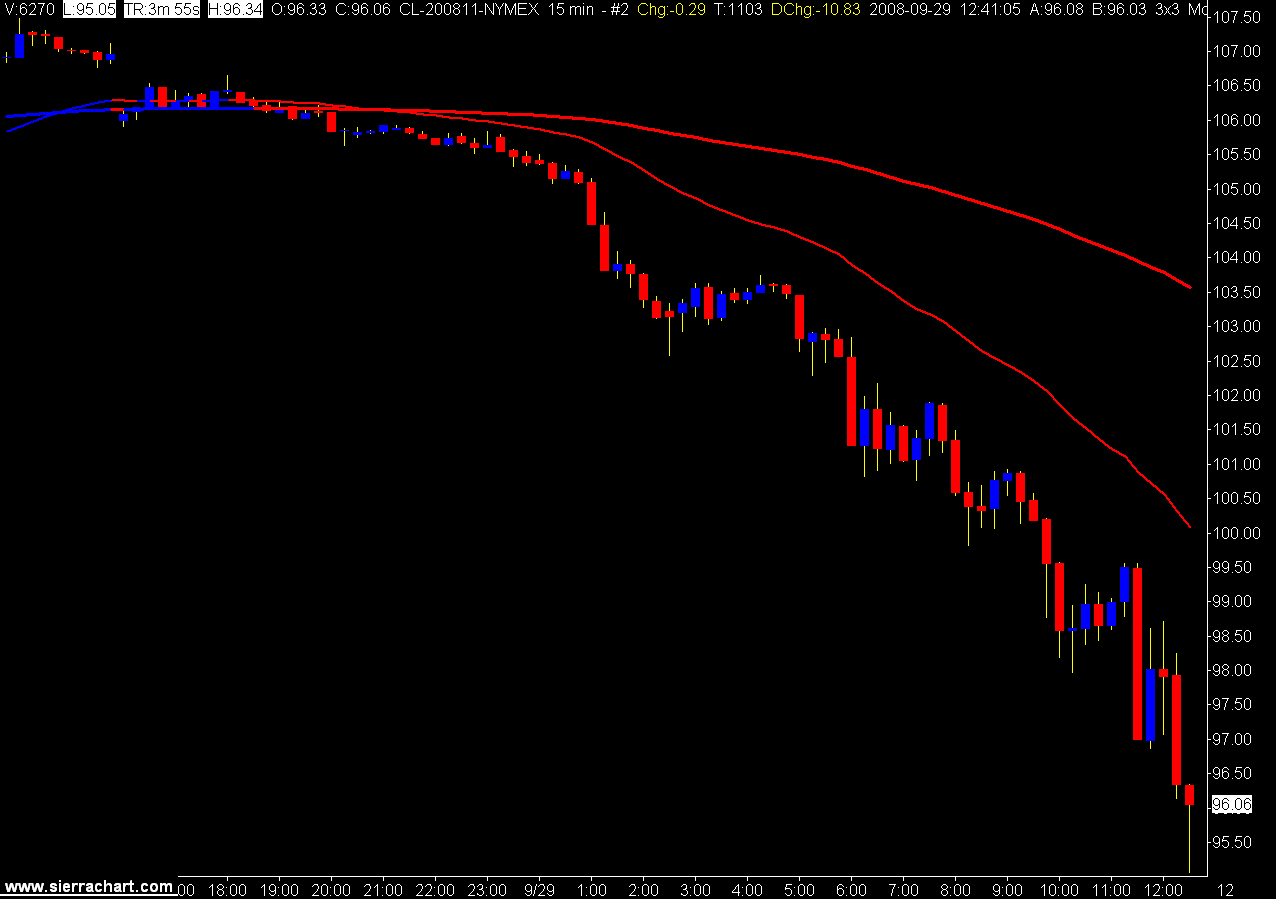
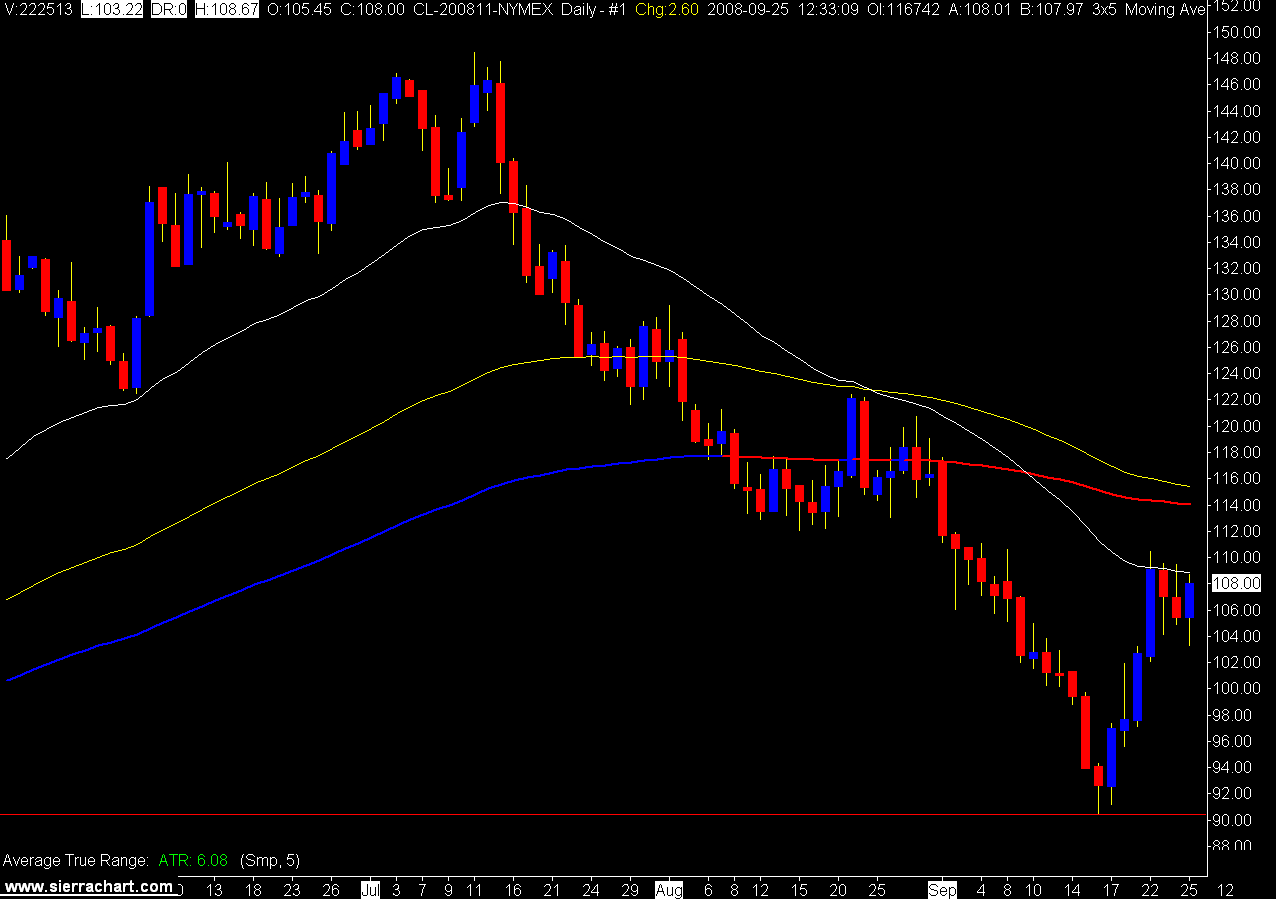
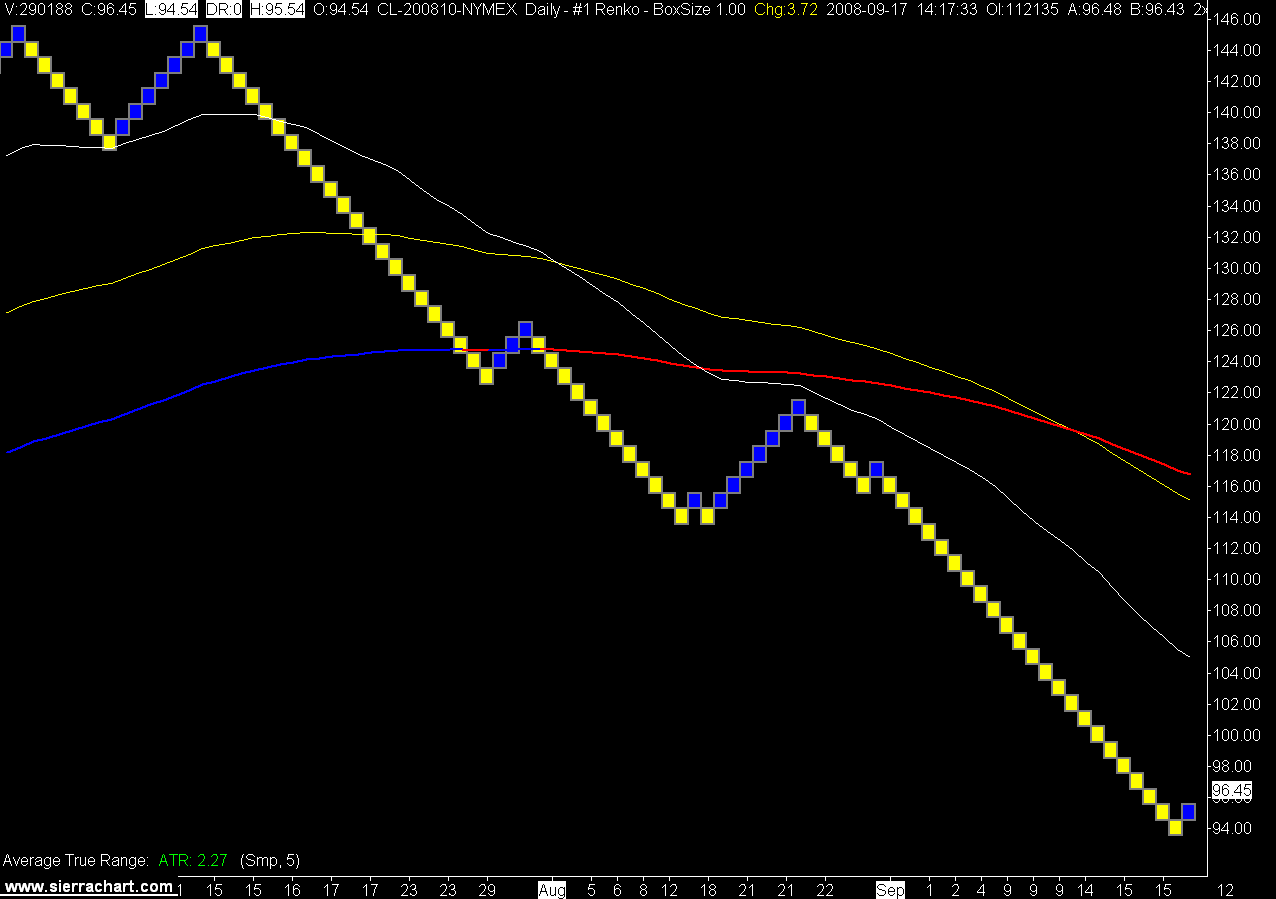
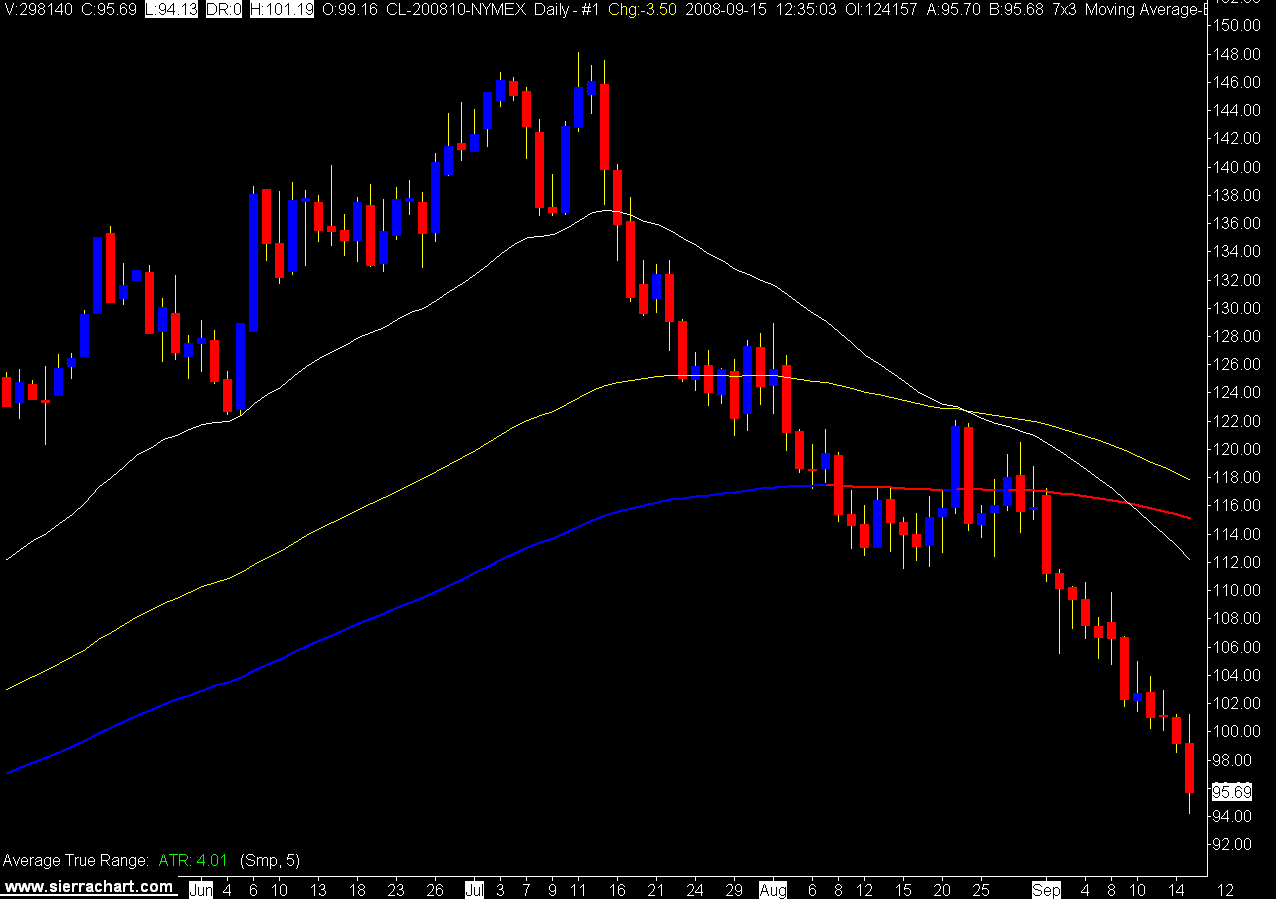
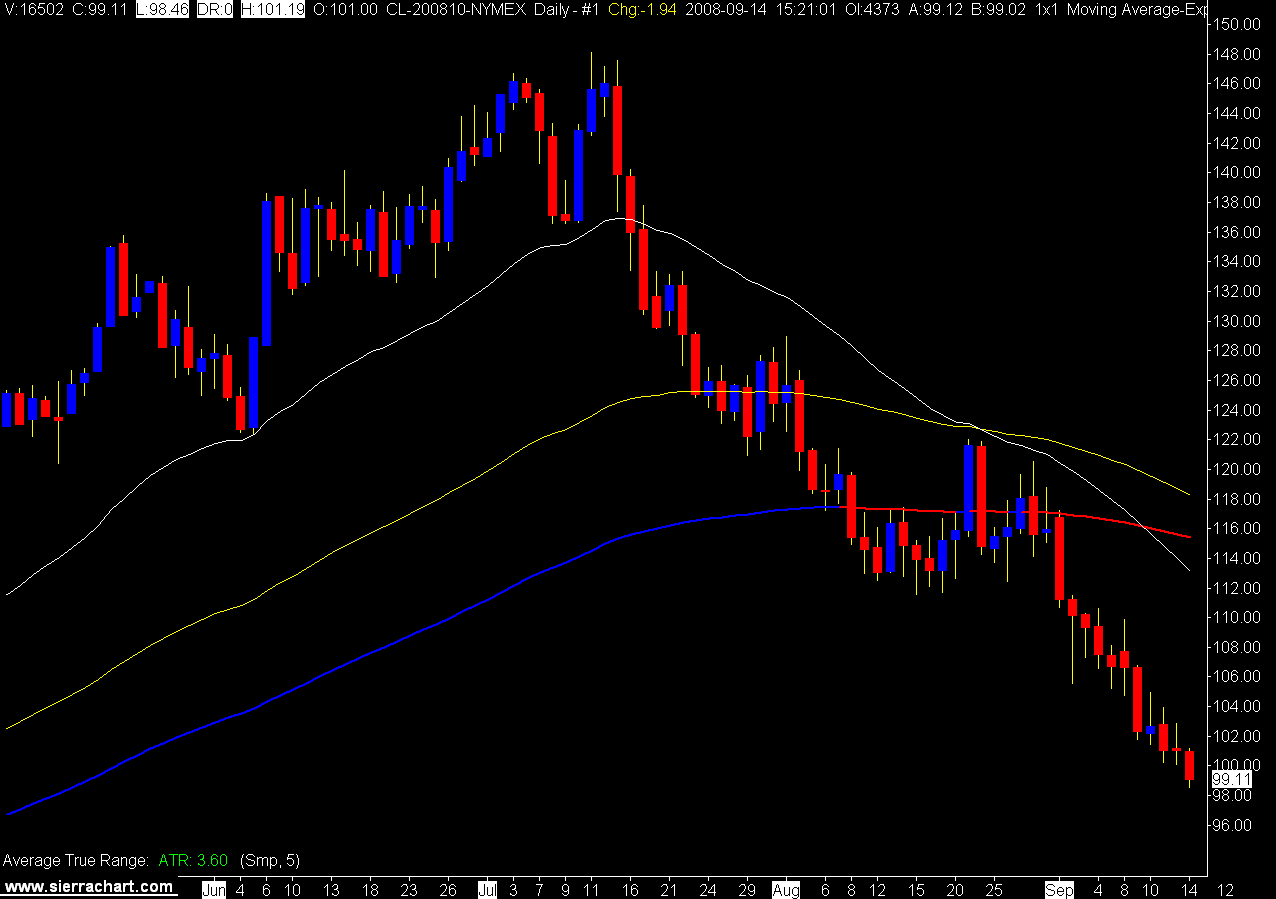
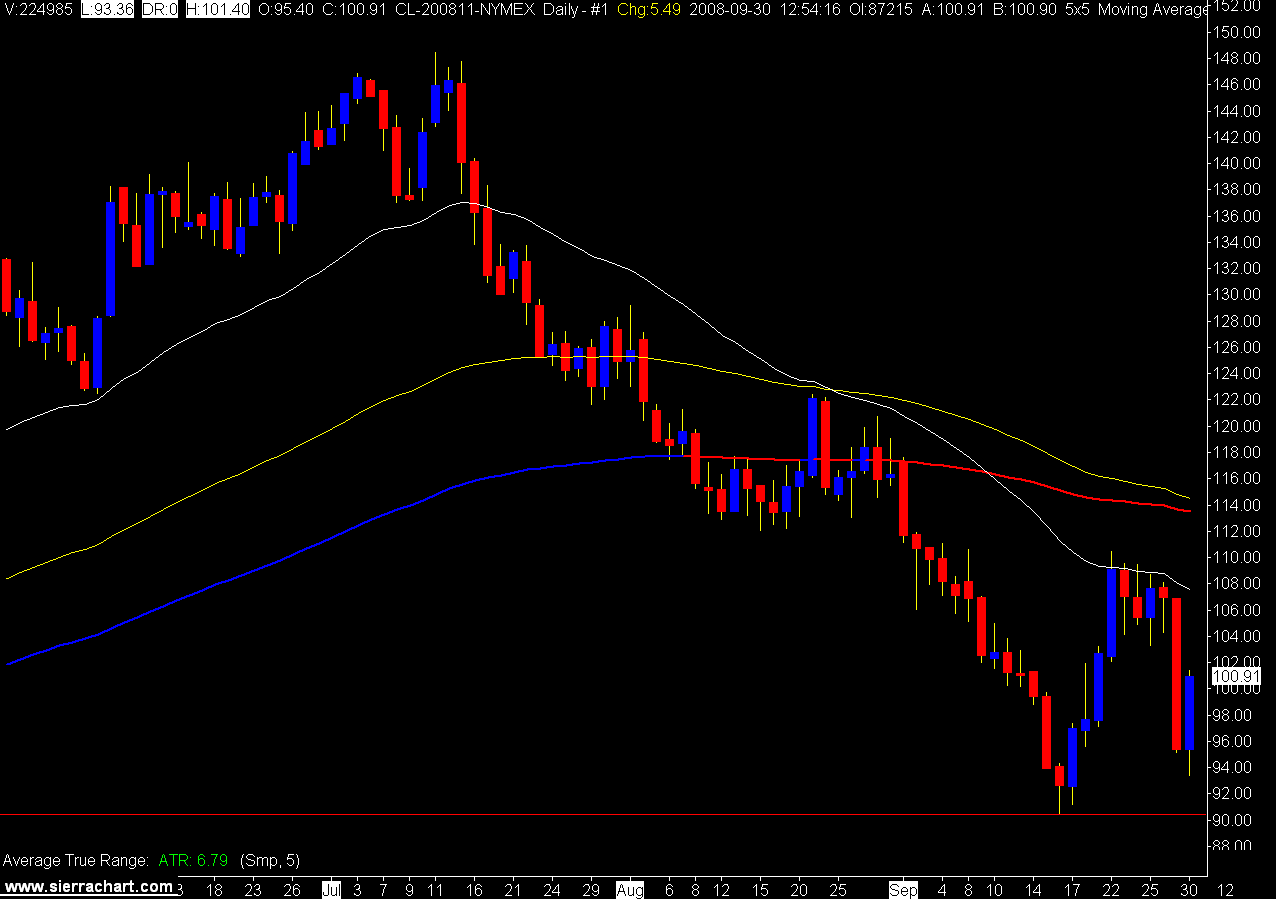
The daily still looks like it is going to head south again, but I don't swing trade so I don't care.

After we find out if Congress is going to do anything, we still have an American consumer with too much debt and American banks that are not going to be quite as willing to lend money.

Of course once the sub prime mortgage crisis settles down we can start on the credit card crisis.

All in all unless China and India can make up for the reduction in American crude oil demand I think oil is headed lower.

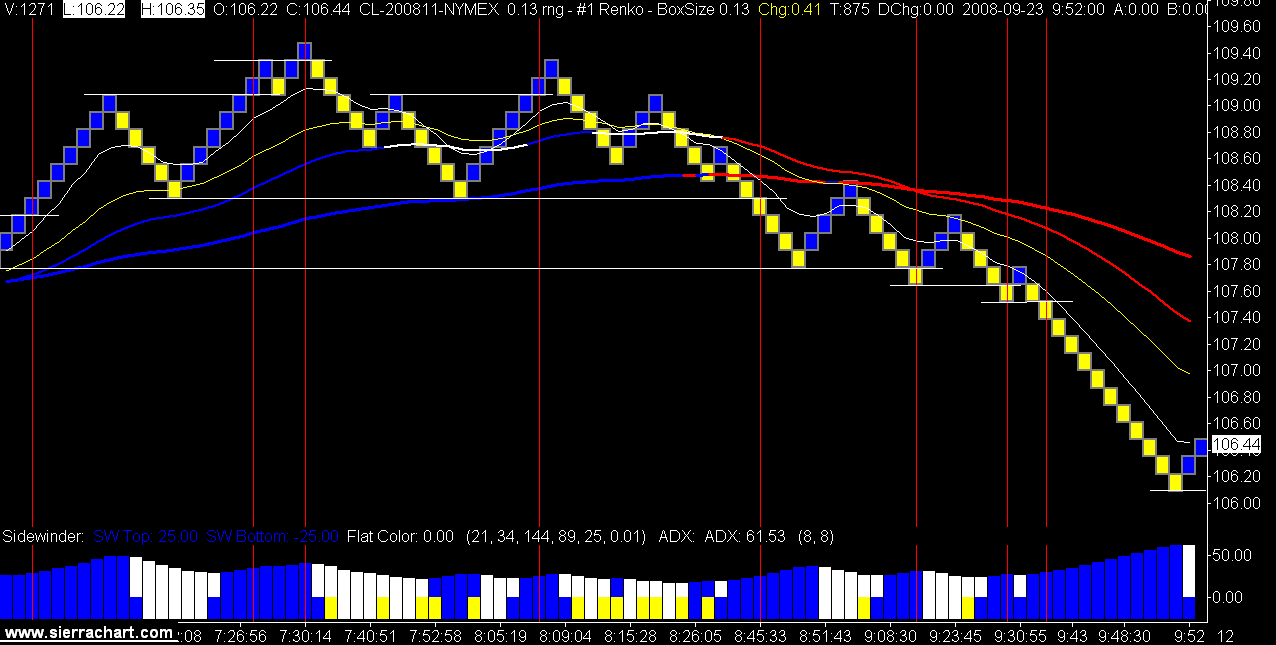
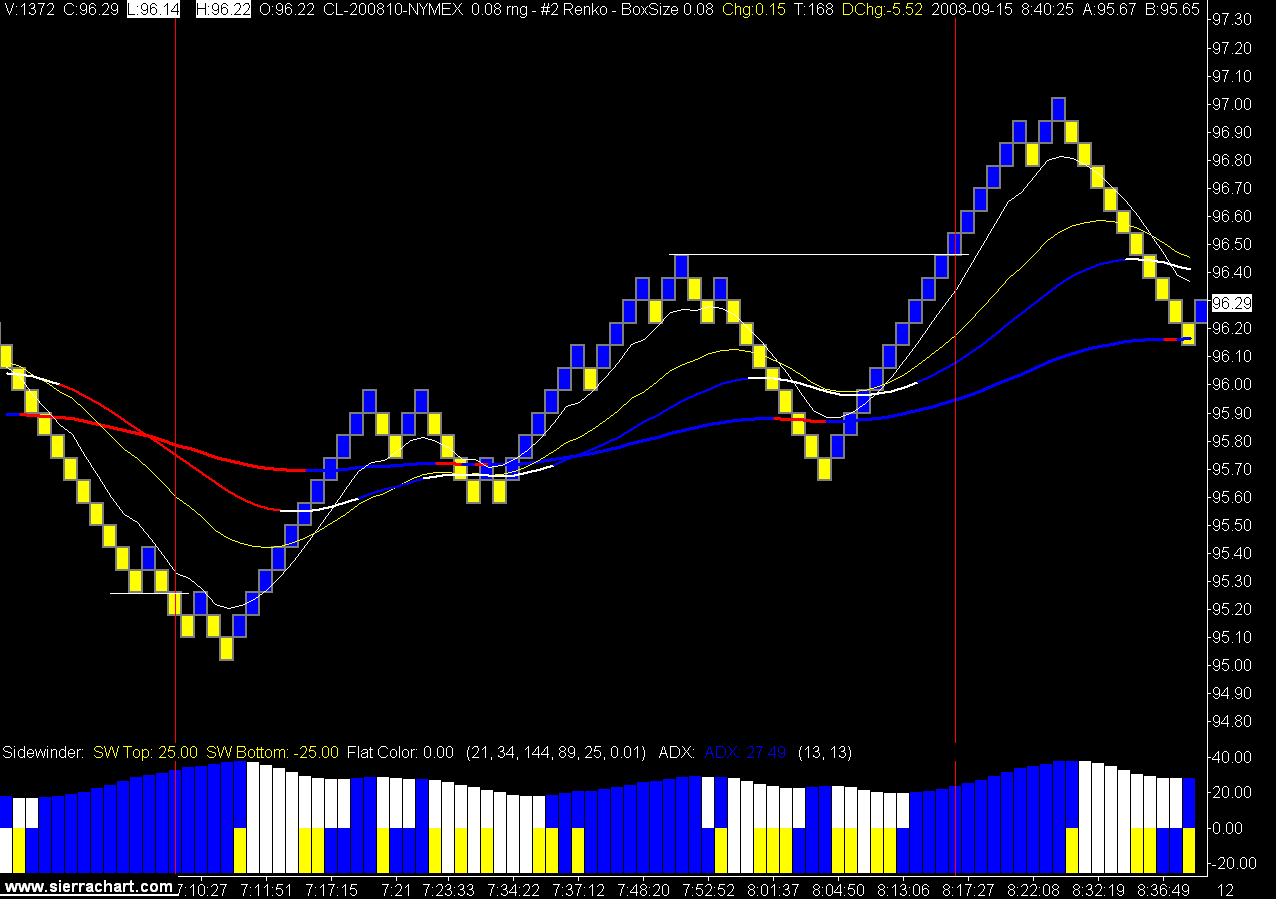
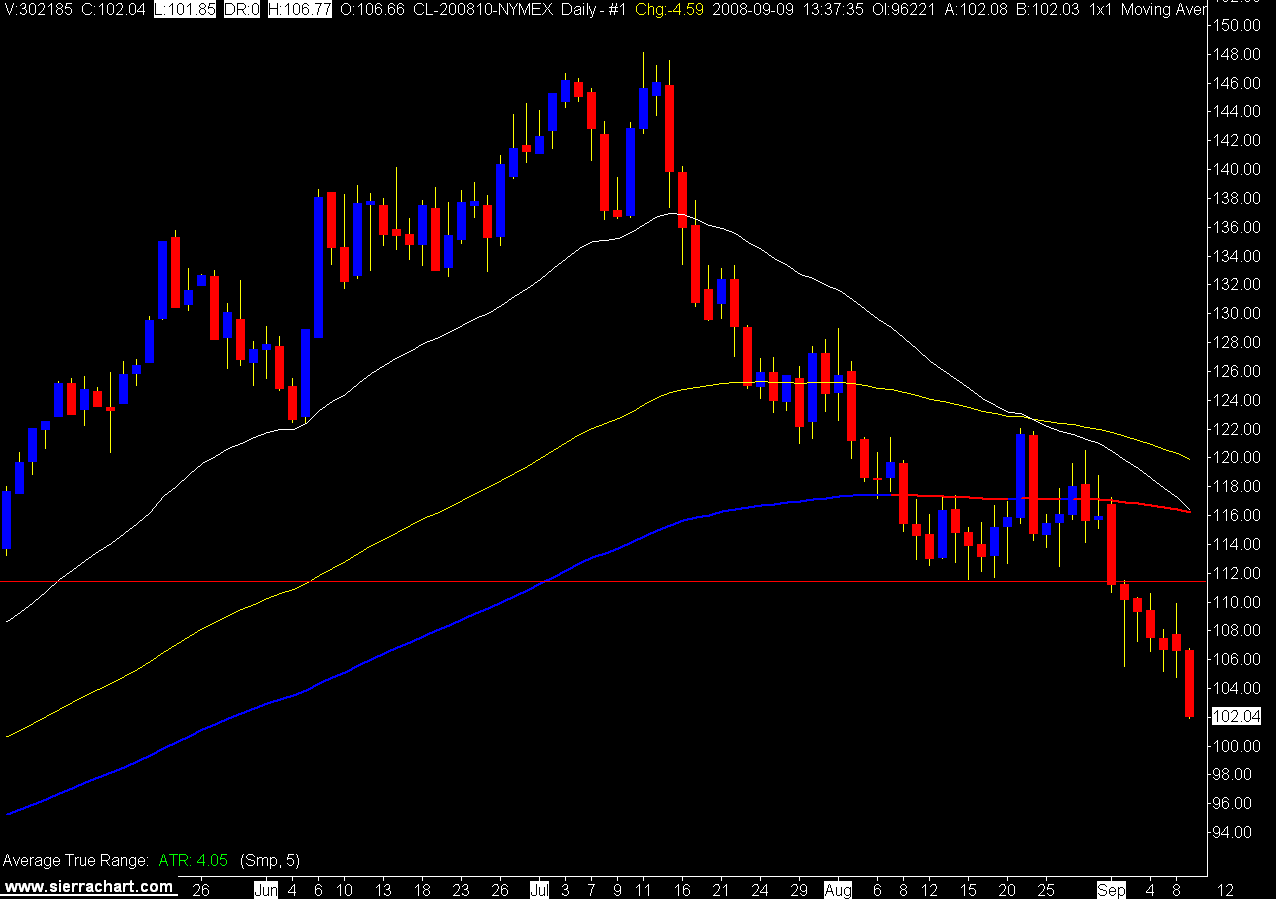
You would think that on a day like yesterday that saw crude oil move $10.00 +, a nice Norwegian, Danish, Swedish, English, Canadian could make some money trading it.

You would think that, but you would be wrong. Yesterday's stats, 1 win, 1 be, 3 losers, for 35 winning ticks / 42 losing ticks = RR .83.

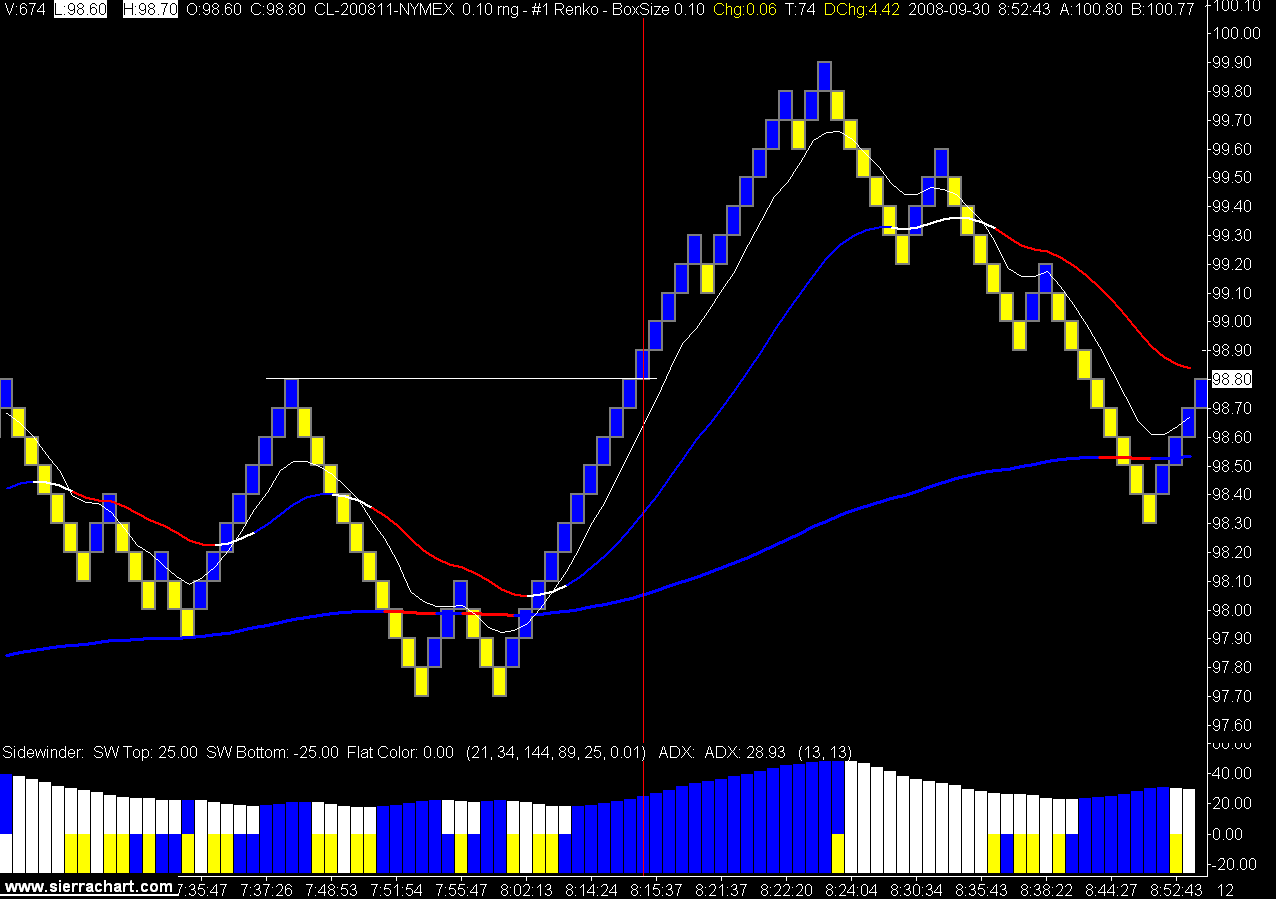
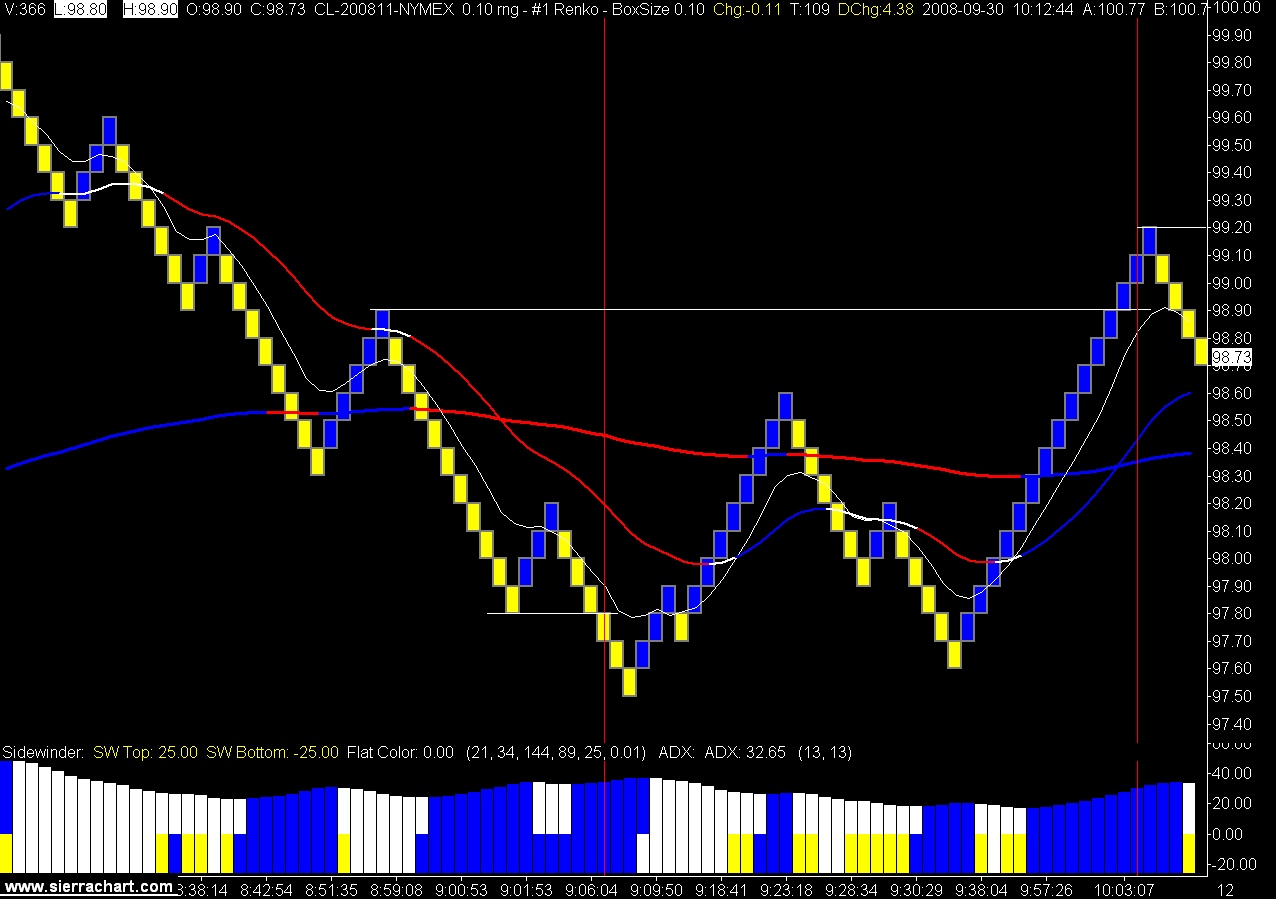
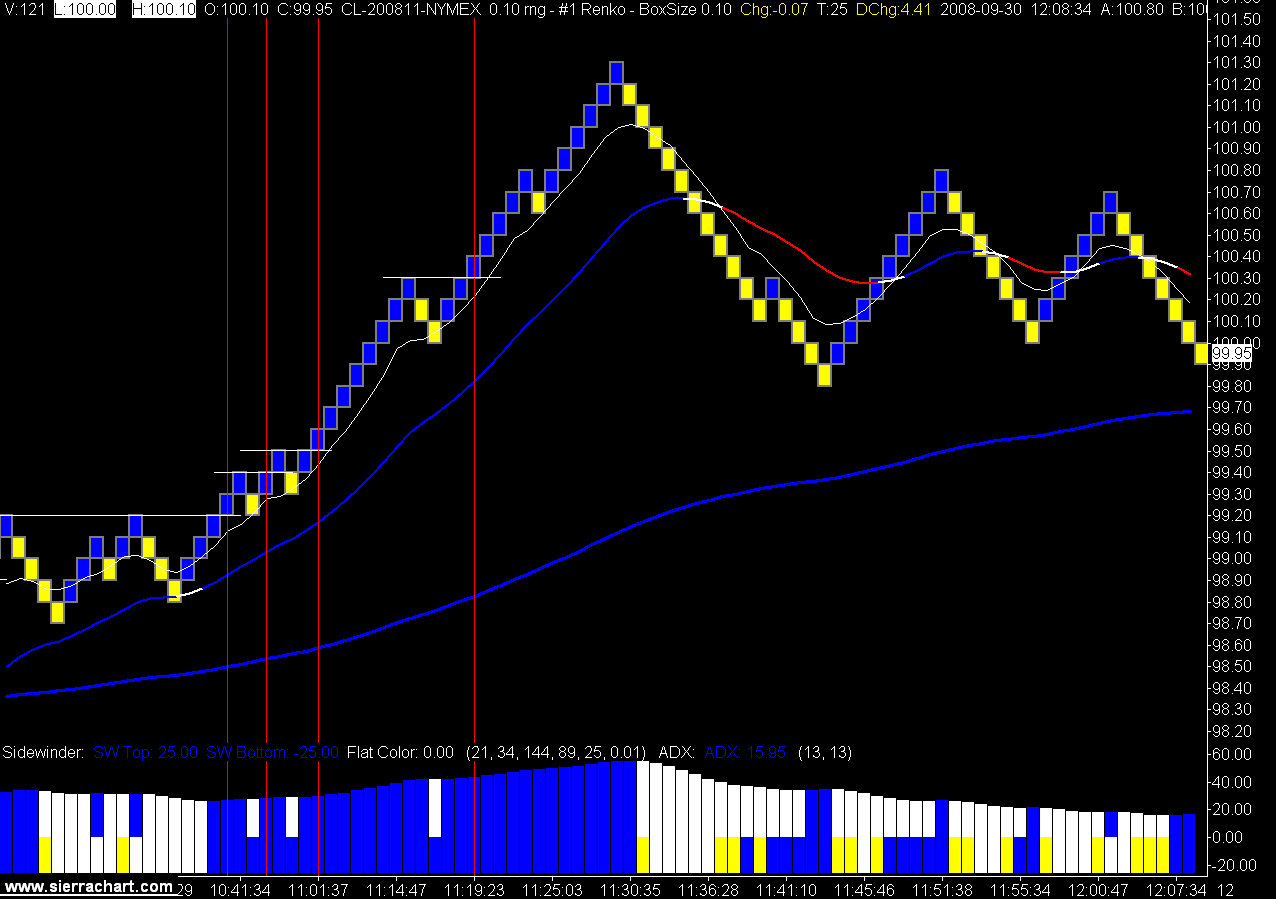
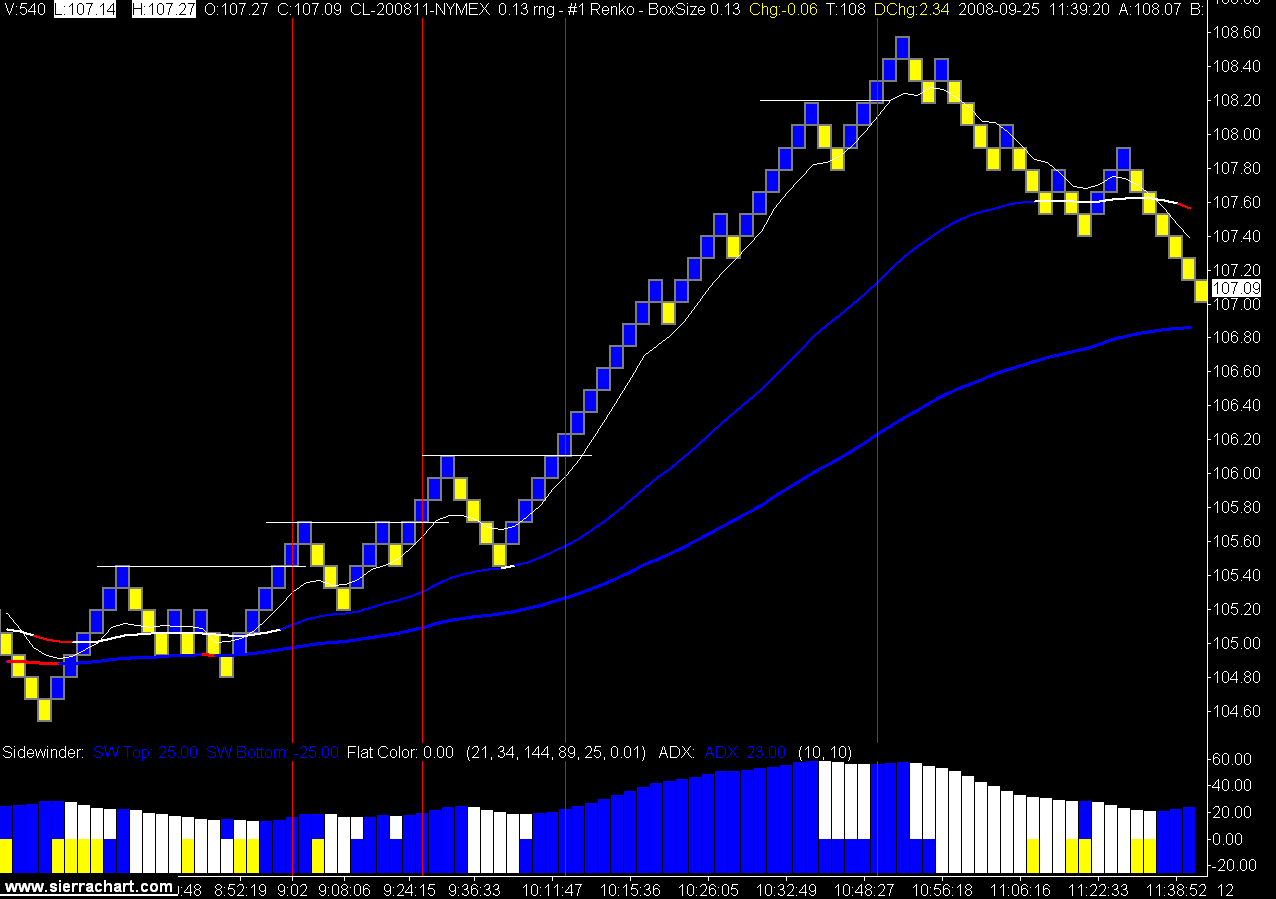
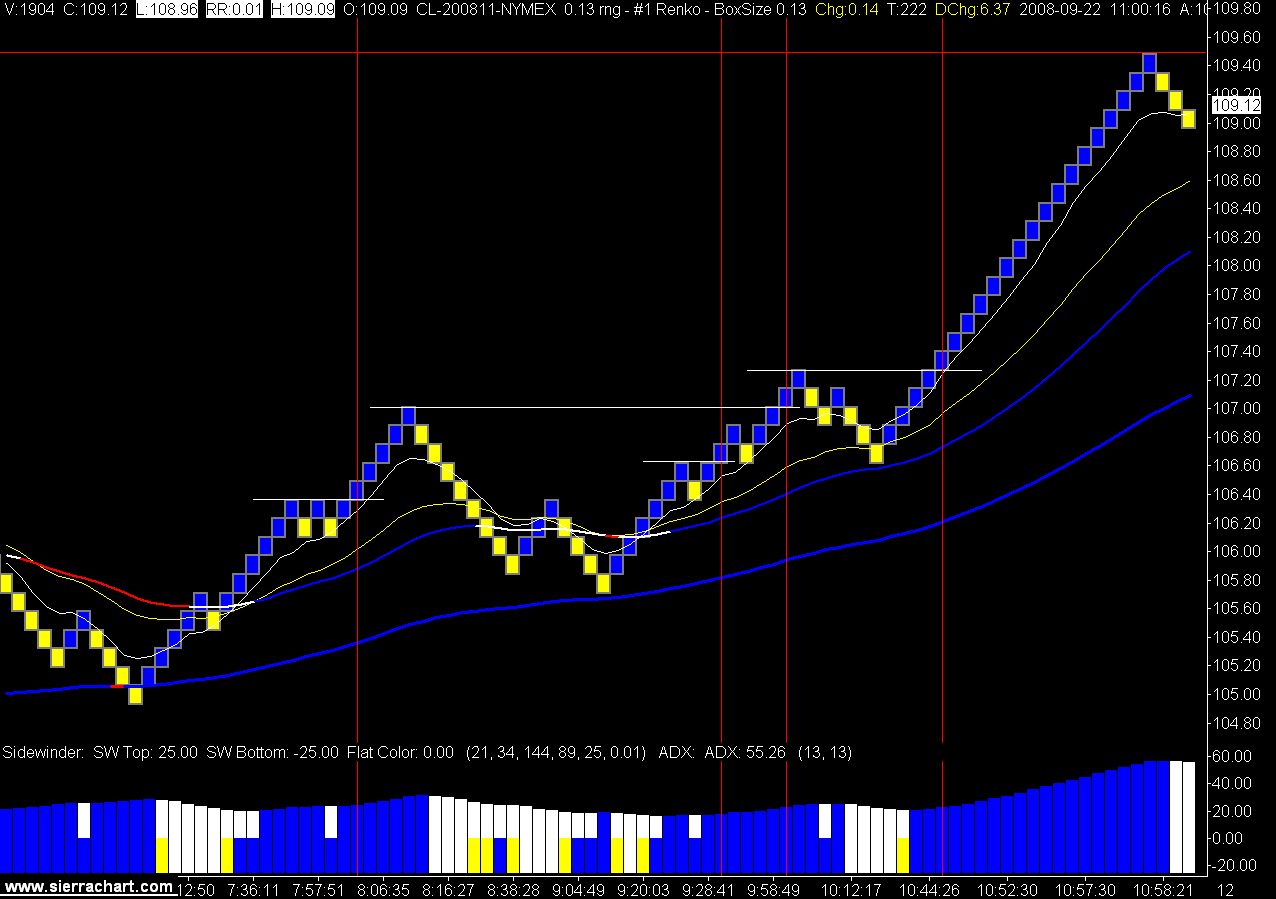
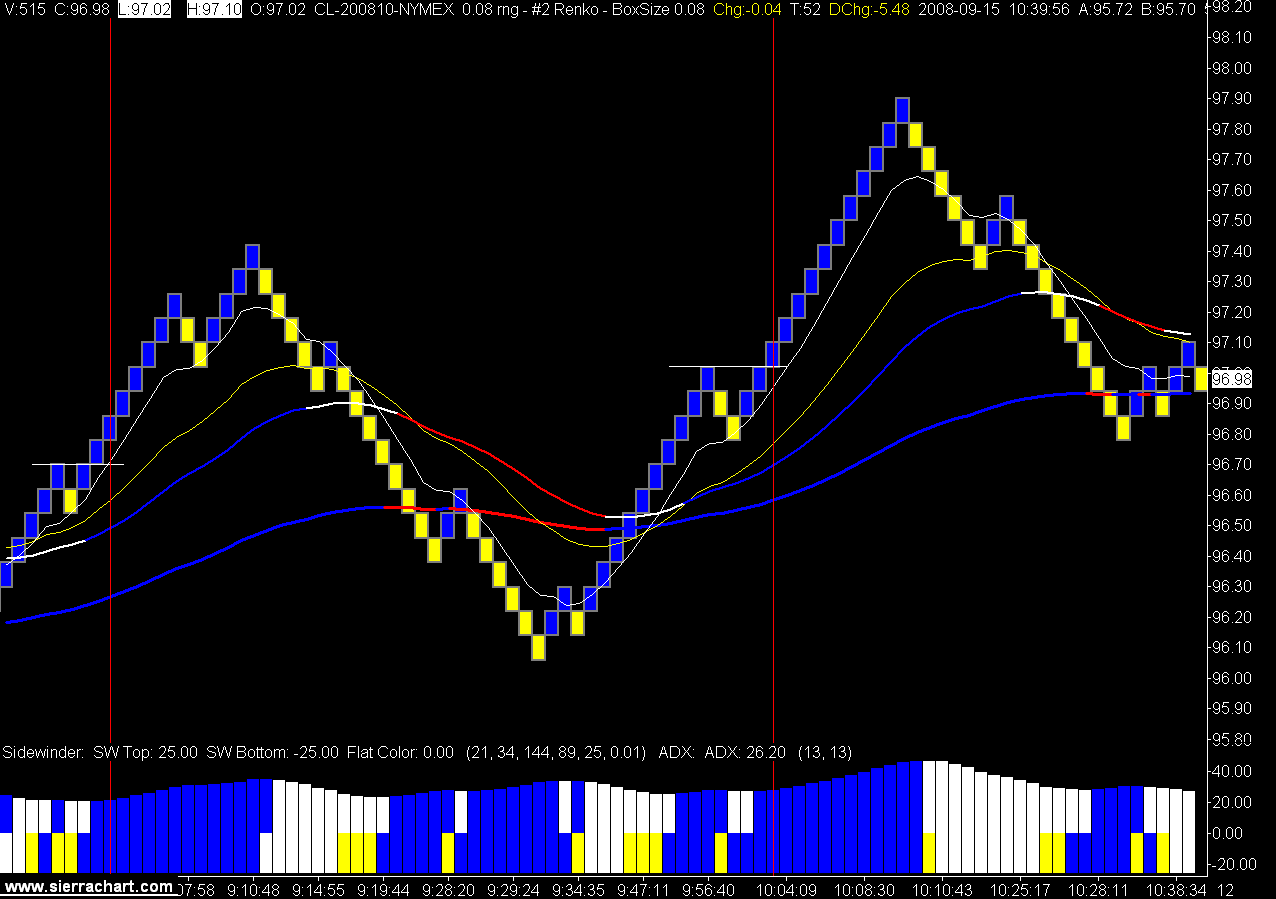
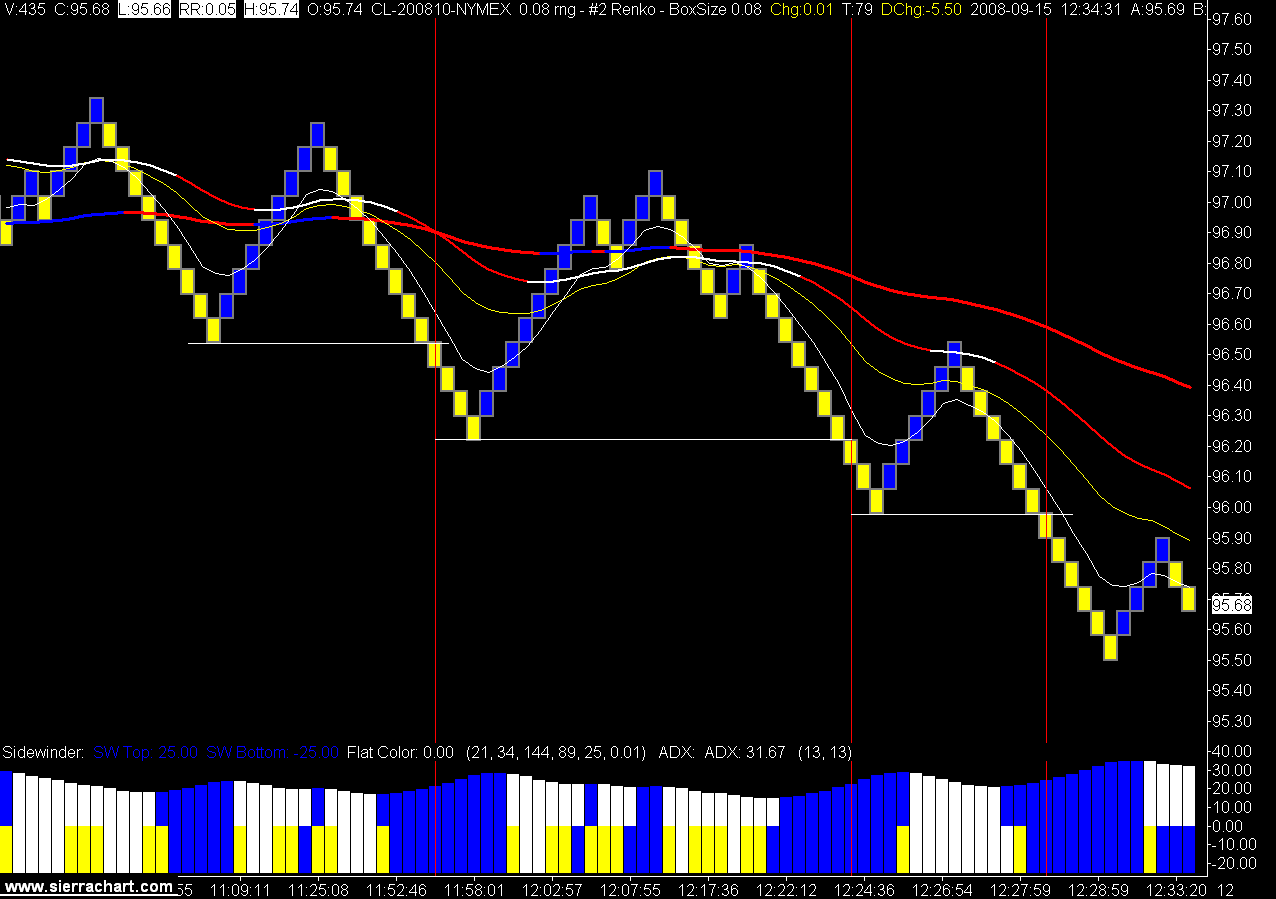
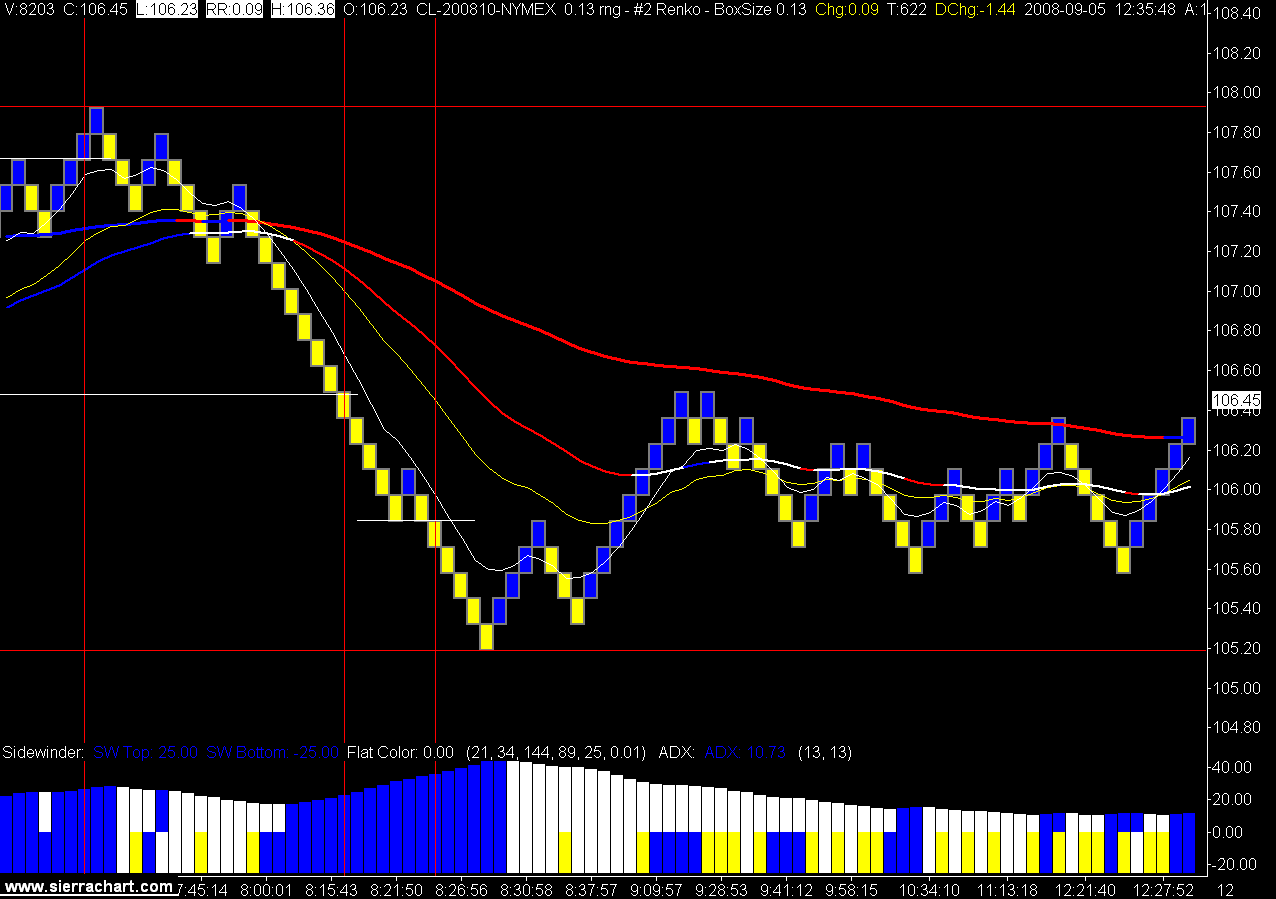
Today's much milder trade had 3 wins, 2 bes, 3 losers, for 108 winning ticks / 38 losing ticks = RR 2.84.

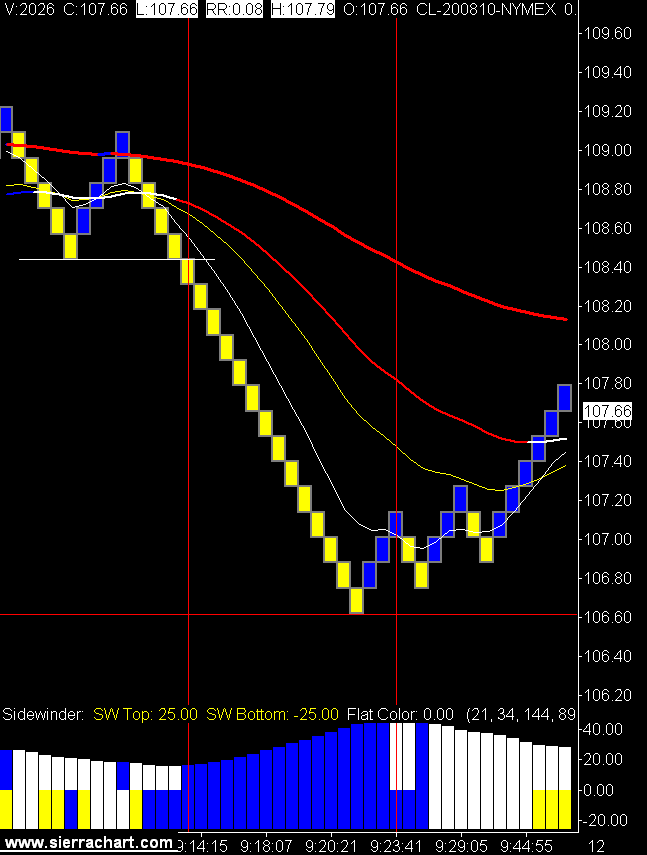
There are times when the trade simply becomes too volatile to trade with your "normal" time frame. The best chart to trade yesterday would have been the 15 minute chart. At least I recognized that my time frame was not working and quit trading early.

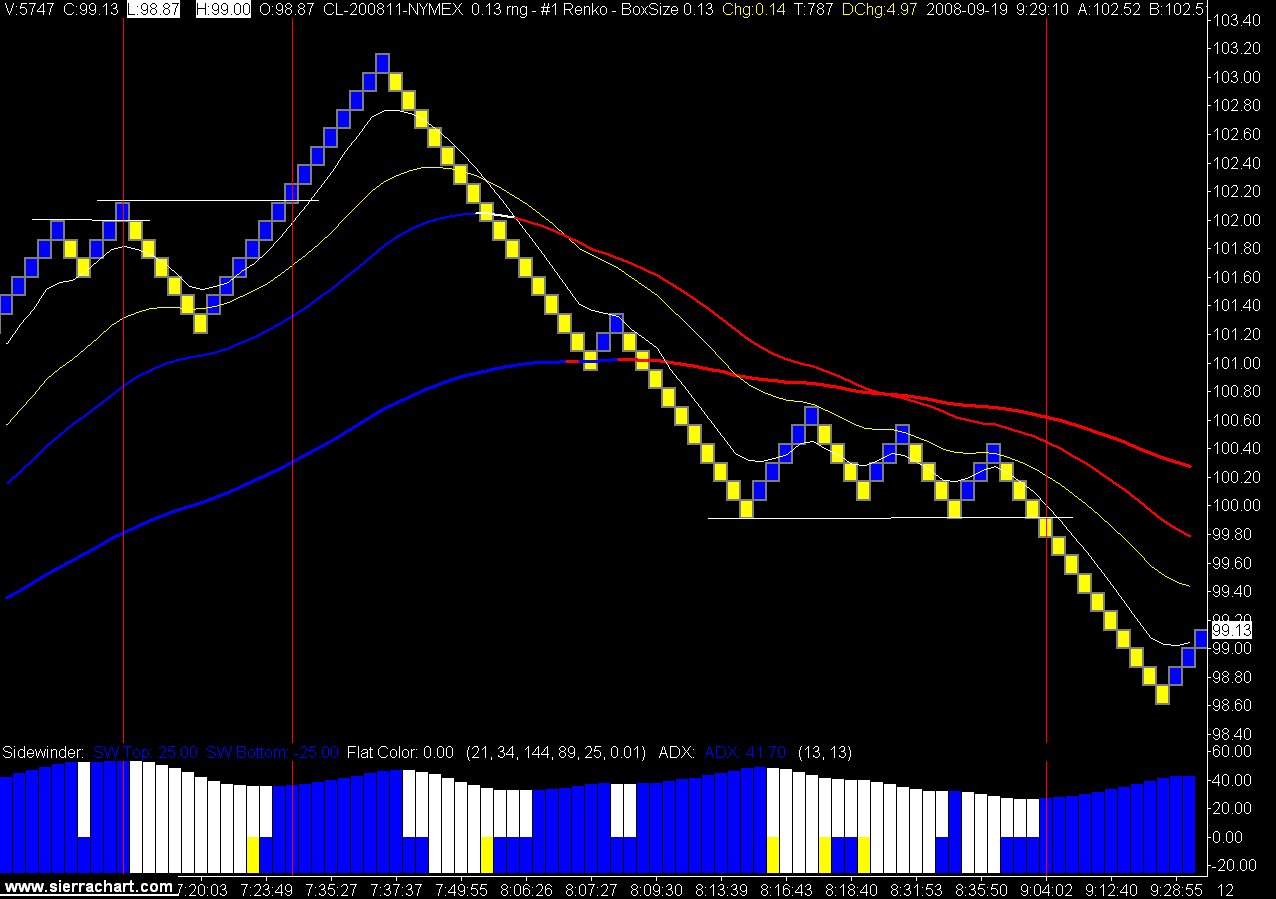
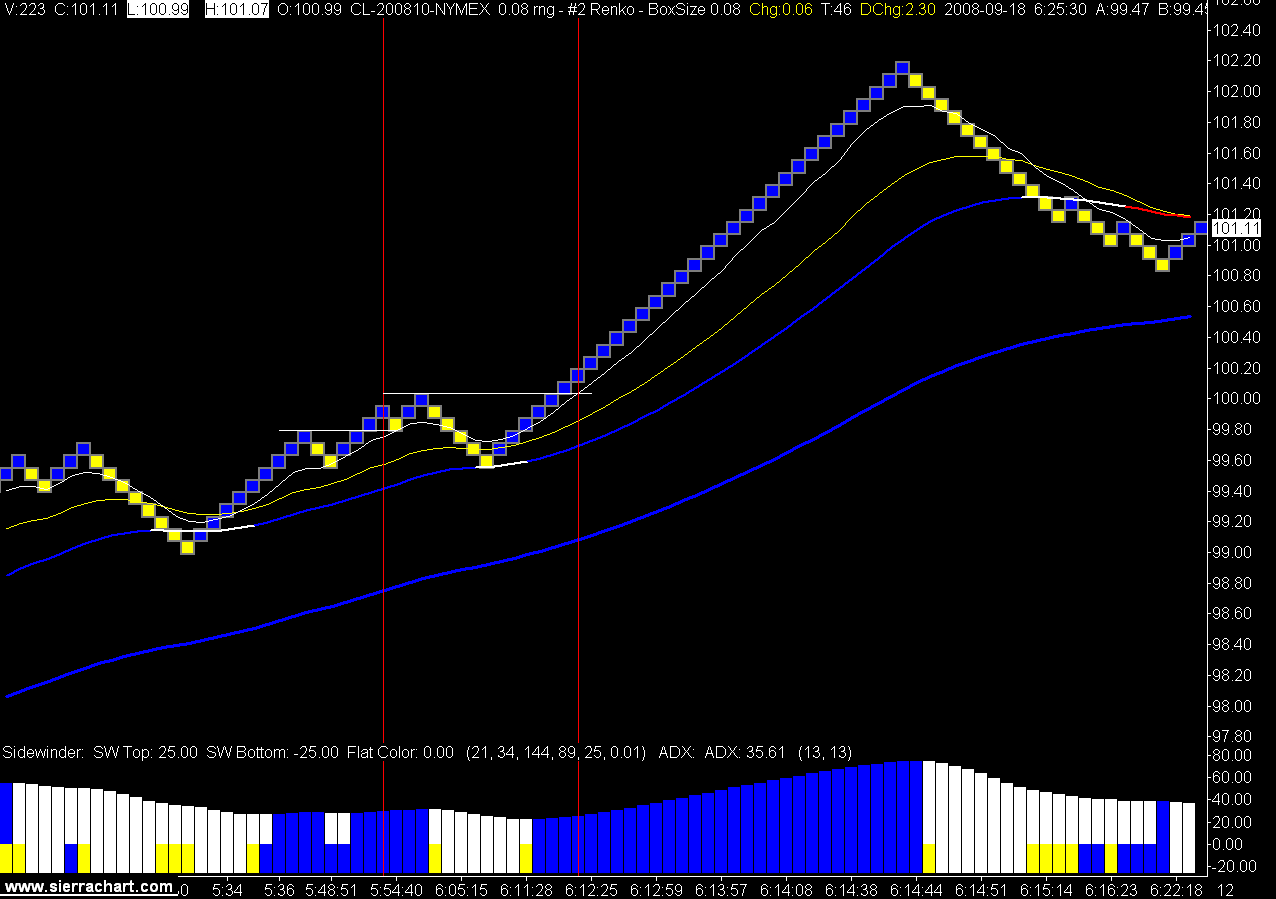
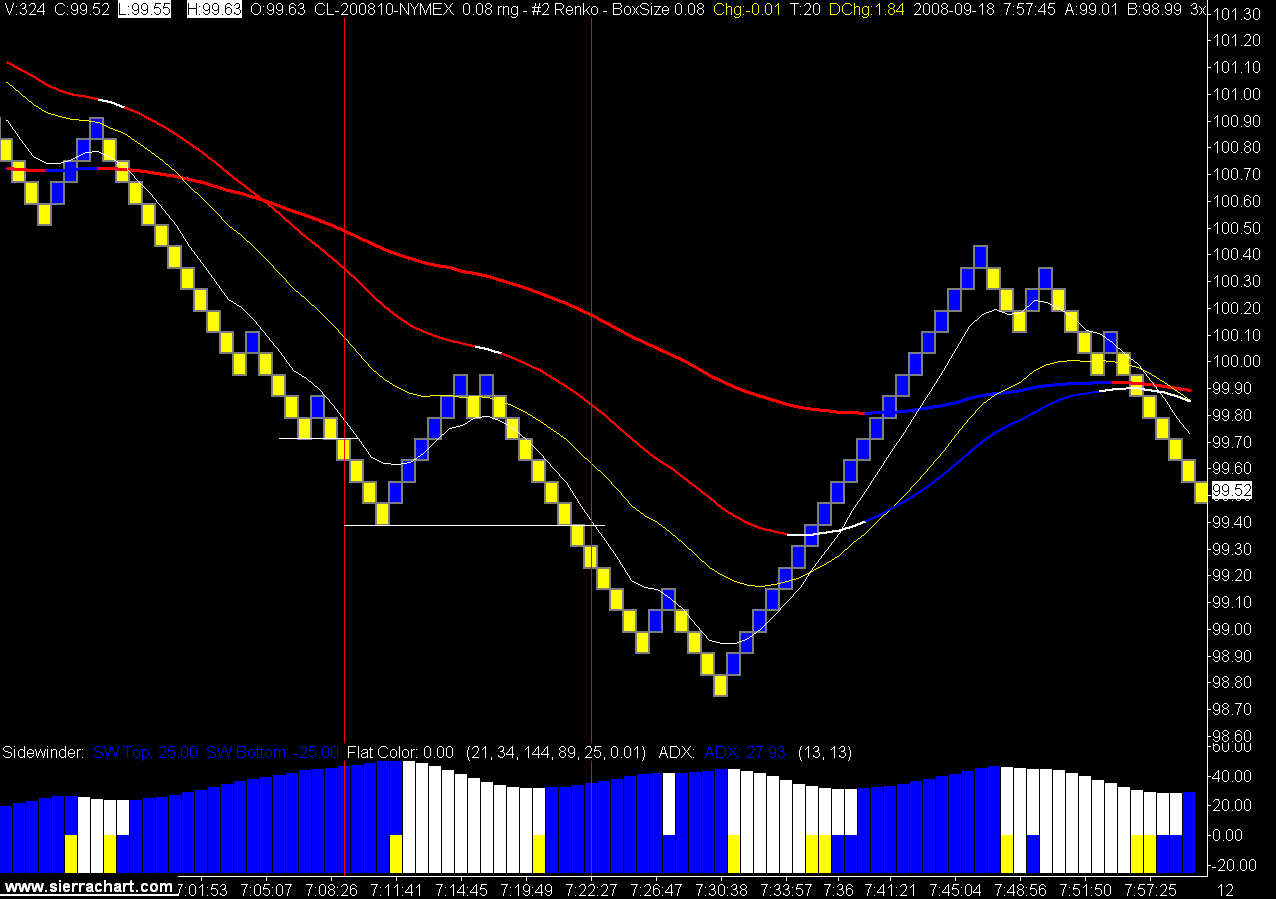
Today's more "normal" price action fits my trade template. One indicator you can use to recognize this is the Average True Range. I keep a 3 minute chart up with a 10 period ATR on for this purpose. You can also see it in the DOM, if price action is jumping all over the place you are either going to have to change your trade parameters or stay out of the market.
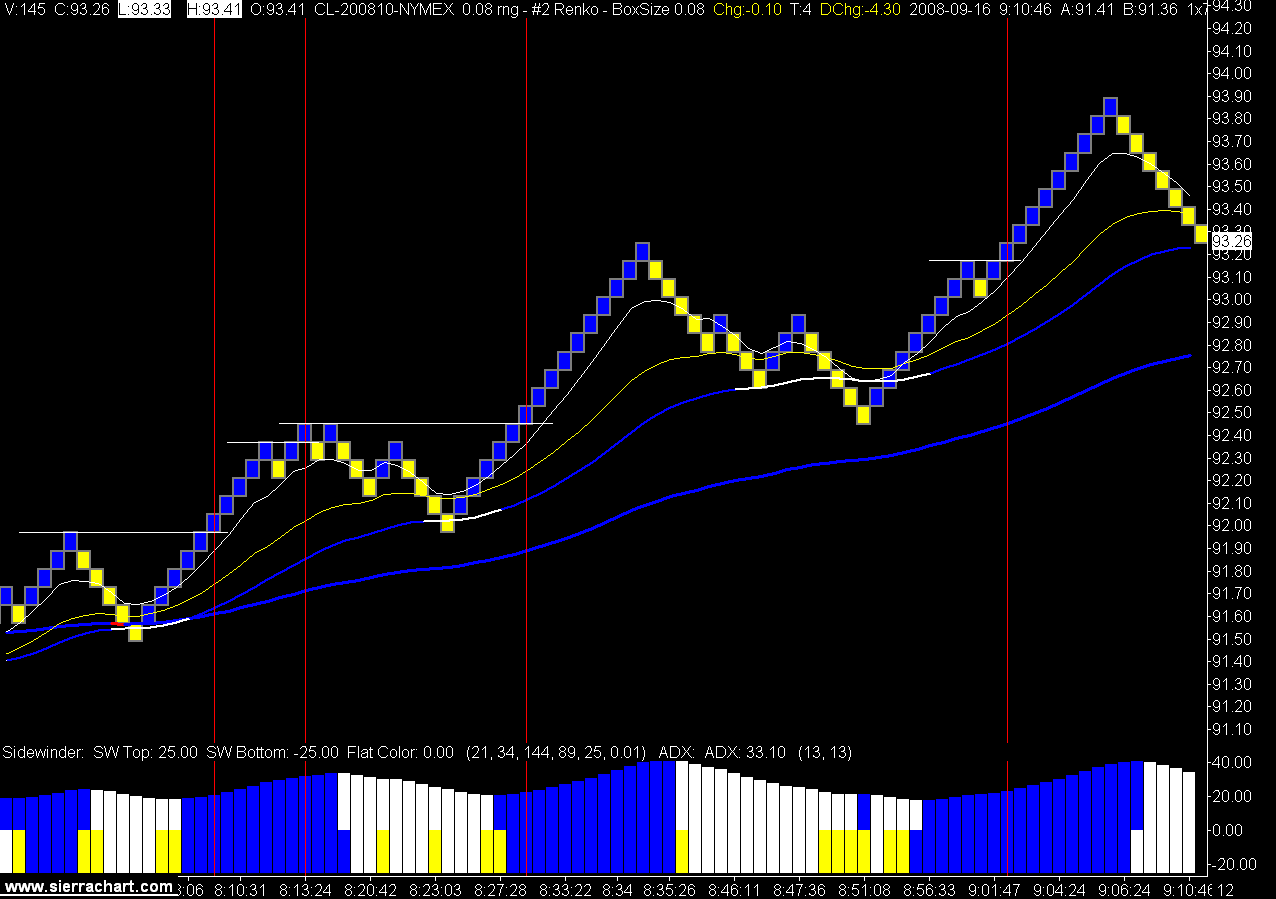
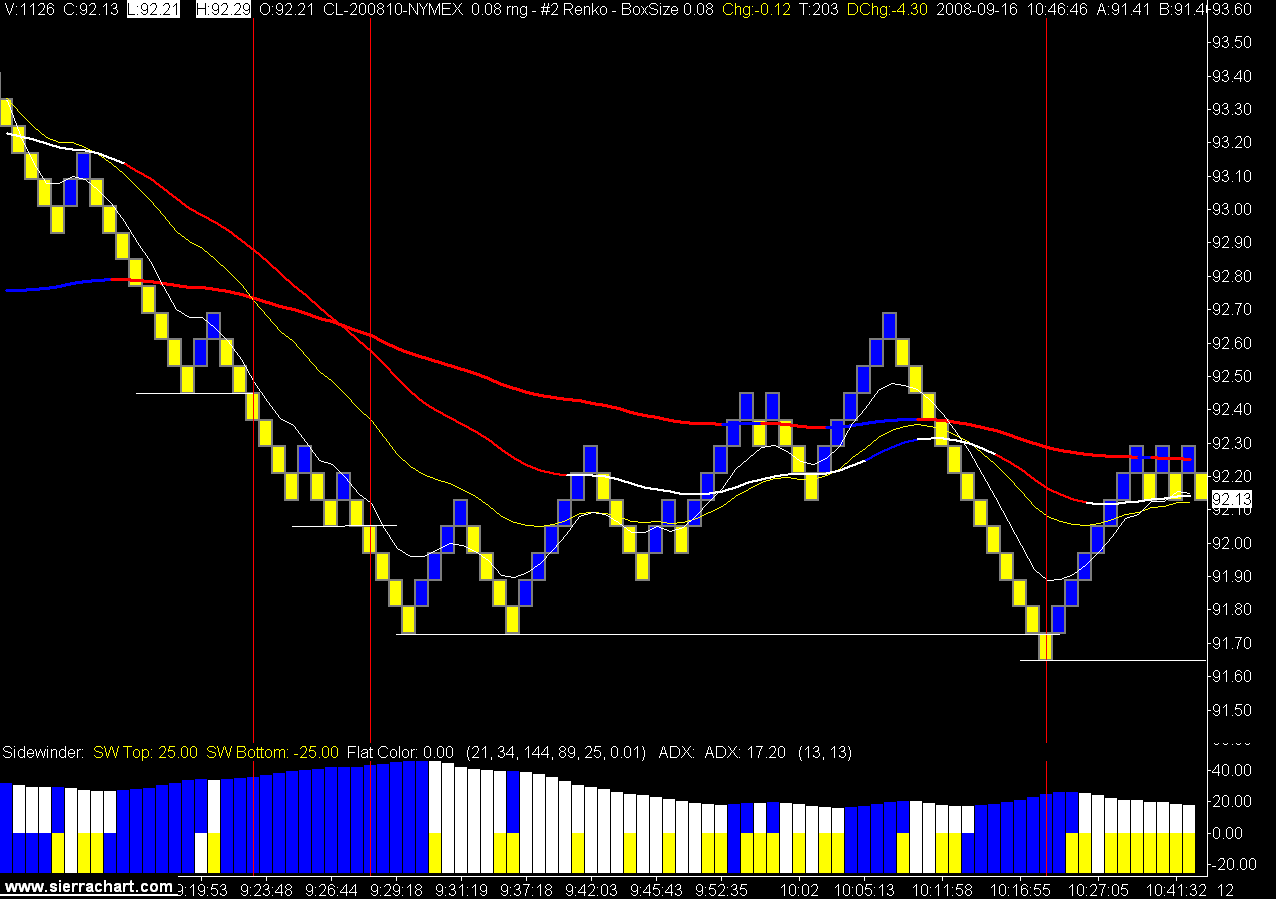
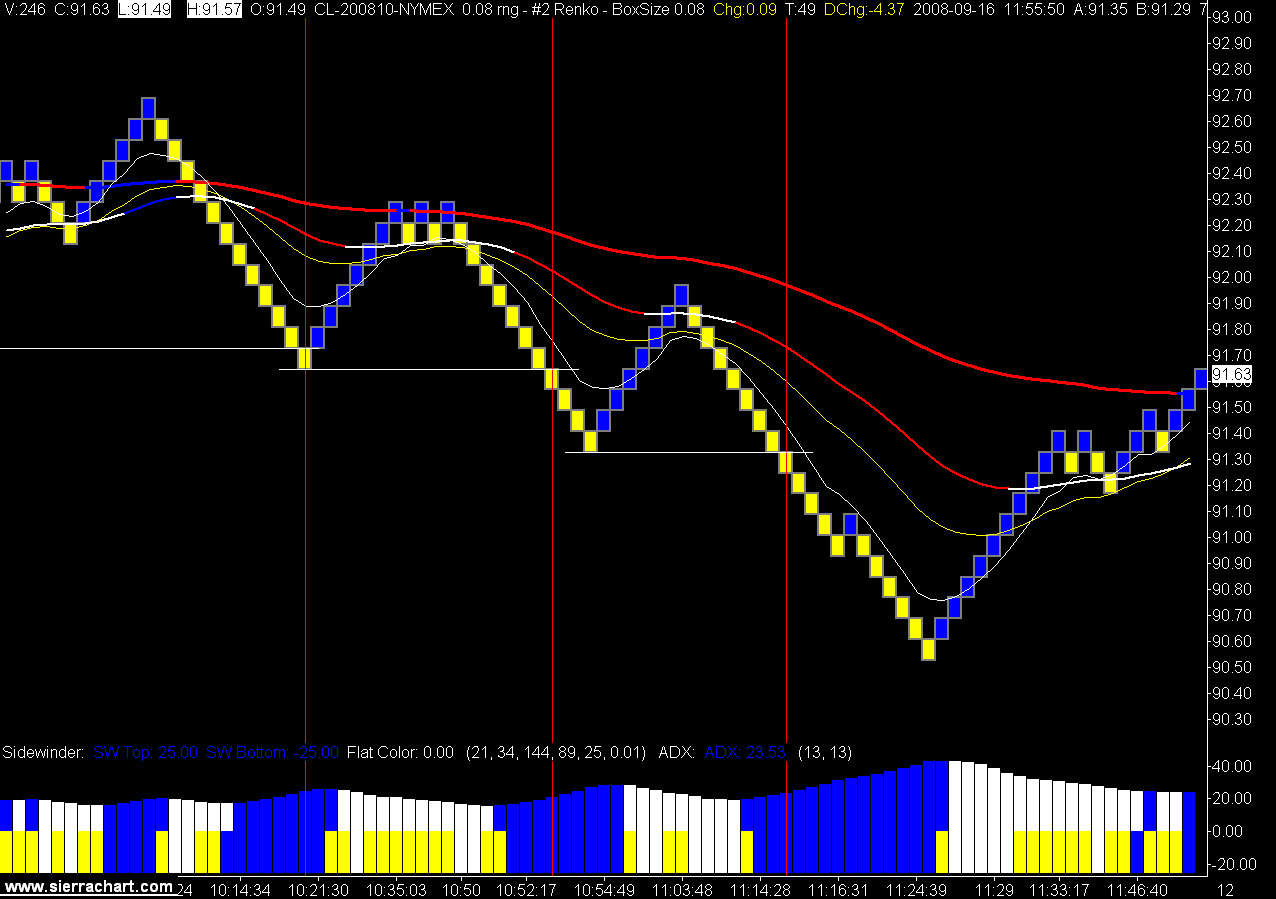
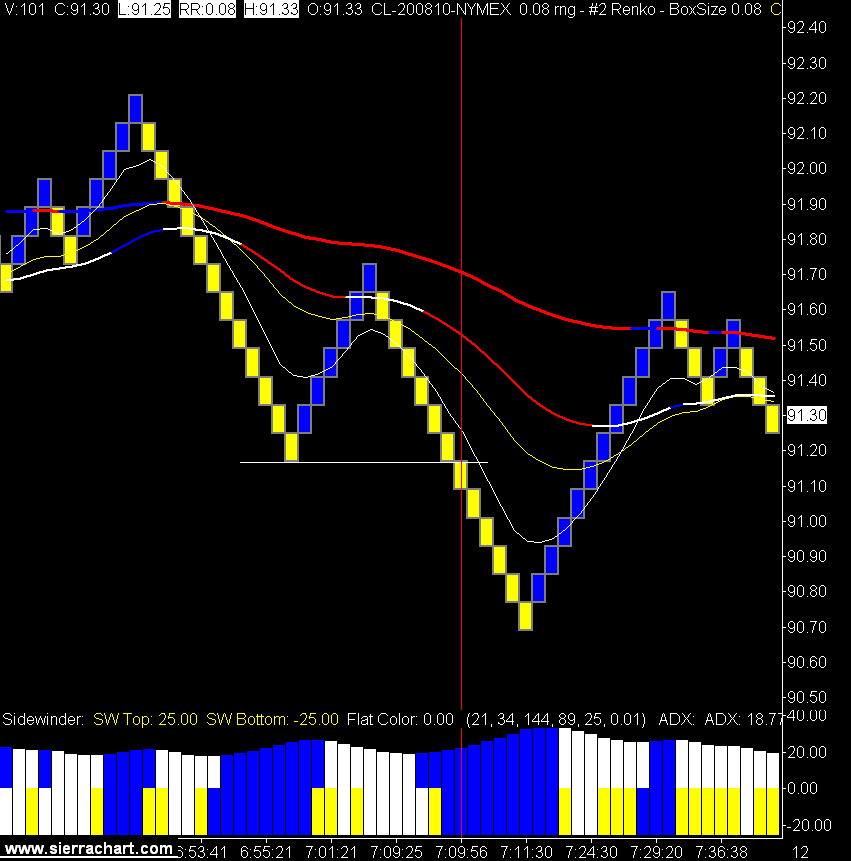
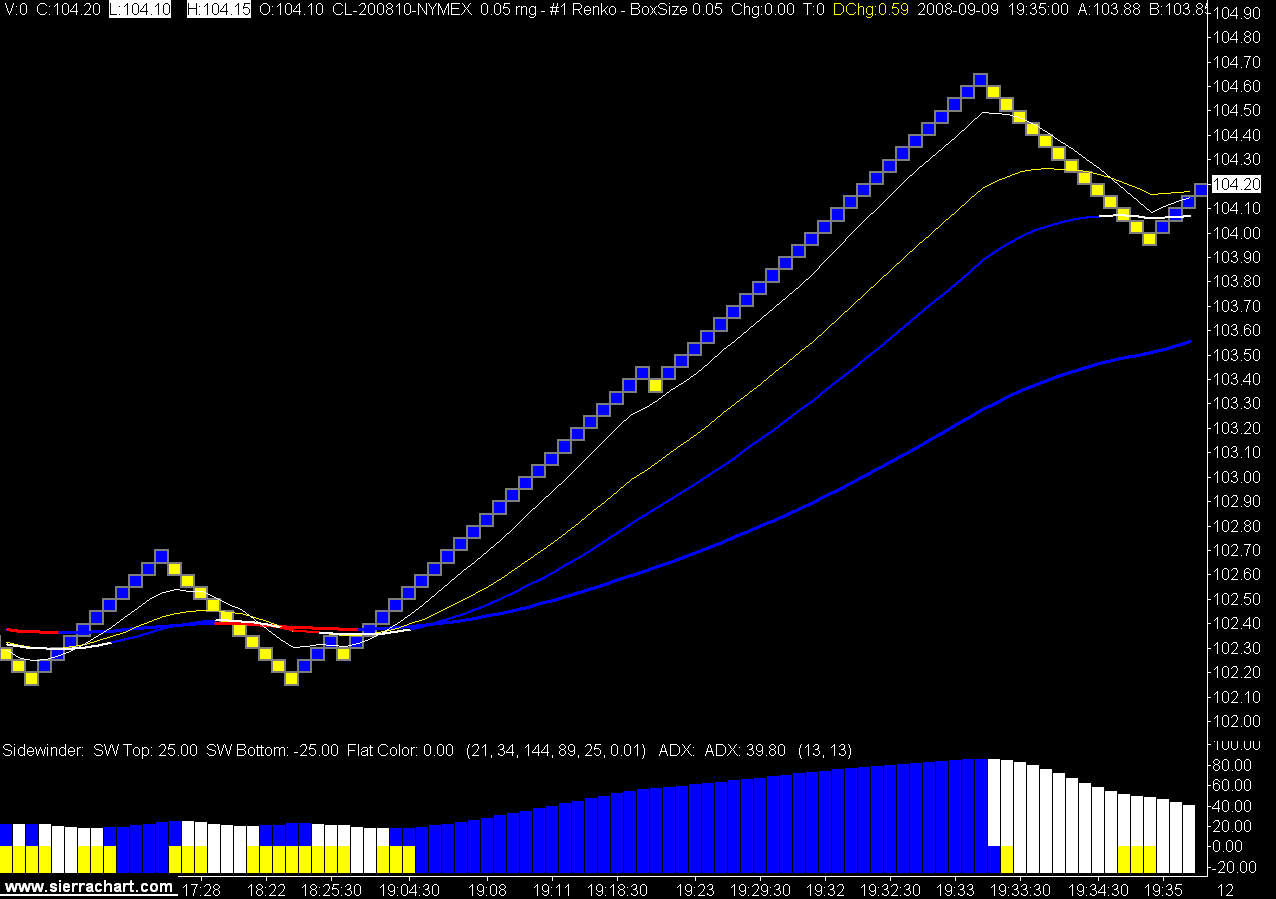
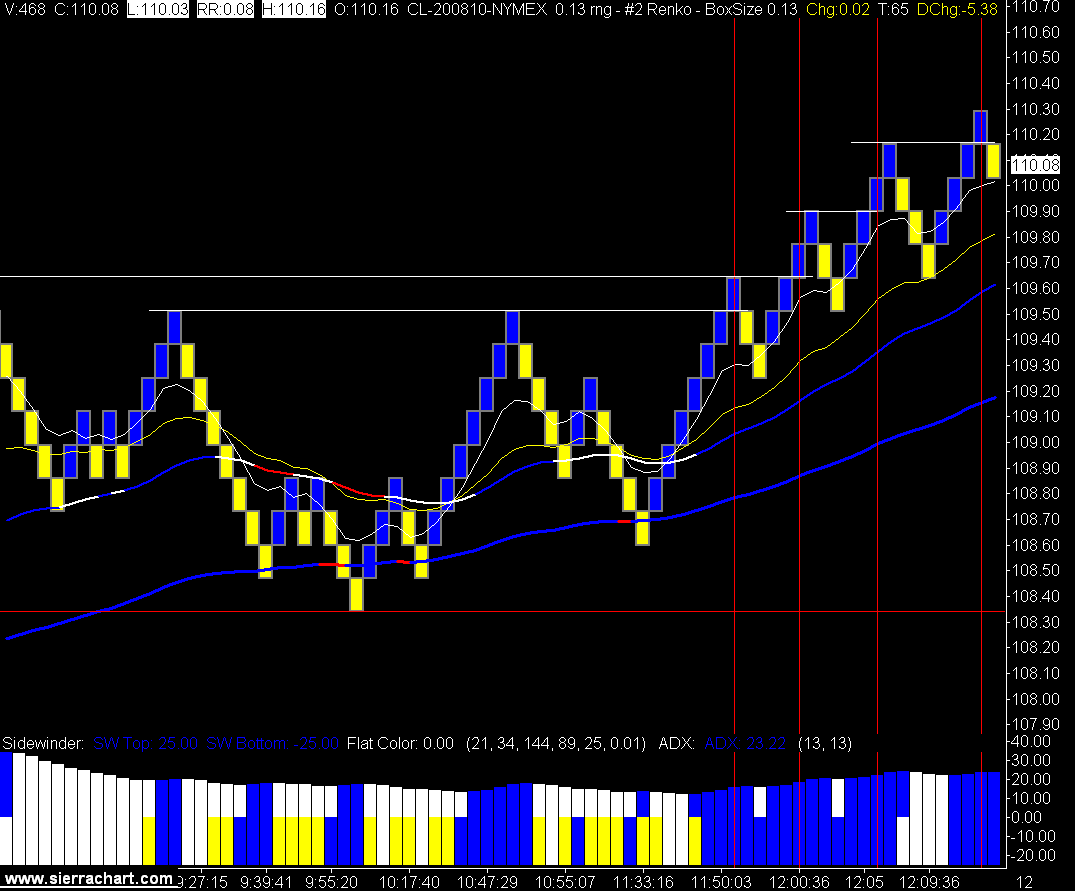
Today's trades

9/29/2008

Now What?

15 Minute Crude Oil Chart (click on chart to view)


I took a couple of trades in the morning, but the overnight trade had already taken all the cheese.

Once the "asset purchase" bill (don't say bailout) failed the market was too volatile for me to trade.

Where we go from here, I have no idea.

This American Life: The Giant Pool of Money

This American Life producer Alex Blumberg teams up with NPR's Adam Davidson for the entire hour to tell the story—the surprisingly entertaining story—of how the U.S. got itself into a housing crisis. They talk to people who were actually working in the housing, banking, finance and mortgage industries, about what they thought during the boom times, and why the bust happened. And they explain that a lot of it has to do with the giant global pool of money.

Clcik on the post title for the link.

http://thislife.org/Radio_Episode.aspx?sched=1242

9/27/2008

Following the Bouncing Oil Price

A photo essay on the action in the pits of the New York Mercantile Exchange.

"One day they're up; the next they're down. No one can predict where oil prices are going, but millions of people are willing to make a bet on them every day. Ben Lopez, a trader with SCS Commodities, uses multiple phones while working in the oil futures pit of the New York Mercantile Exchange, located in Lower Manhattan."
Photo: Ruth Fremson/The New York Times

Click on the read more icon for the full NY Times photo essay.
read more digg story

A Pigeon and a Stock Trader Are Stranded on an Island

"On Wall Street, a black day is almost always followed by black humor in trading floor jokes, finance blogs, videos circulated on YouTube and doctored photos sent by e-mail between traders." By Tim Arango, NY Times

Click on the read more icon for the full NY Times story.

John Bird and John Fortune explain the sub prime credit crisis.


read more | digg story

9/26/2008

WaMu Goes Down


JP Morgan buys what's left of the WaMu carcass. I hope they don't get rid of their great ads.

Although maybe those "stodgy old bankers" weren't so stupid after all. Most of them work at JP Morgan.

Feds seize WaMu in nation's largest bank failure
"Washington Mutual, just days ago the nation's biggest thrift and once its biggest mortgage lender, earned a final, notorious distinction Thursday: It became by far the biggest U.S. bank in history to fail." Drew DeSilver, Seattle Times

Click on the read more icon for the full Seattle Times story.


read more | digg story

9/25/2008

Crude Oil Trades

Daily Crude Oil Chart (click on chart to view)


The daily chart has run into the 34 EMA (white line) and looks like it could revert back to the downside. Either that or its waiting for the U.S bailout package to be finalized and all will be well in the neighborhood.

I think demand for oil will continue to drop, and when the gulf production gets back to 100% oil could be headed south.

13 Tick Crude Oil Renko Chart


The oil trade was very quiet with a couple of strong long moves today. I was not in the first move as it started to far south. It took 3 cracks before the second long move got going, but going it did get.

I have been taking a look at the YM (Mini Dow) this week as an "exceptional Irish trader" tells me its the thing to trade since the ER2 (Mini Russell) moved to the ICE platform.

My interest is due to the smaller tick value and the idea of a multiple contract system. Not sure if I will proceed, but don't be shocked if you see a YM chart showing up sometime.

9/24/2008

They're Making This Up as They Go

This sounds like a 700 billion dollar plan drawn up on a napkin.

9/23/2008

"Privatized Profits, Socialized Losses"

Hmmm.


Warren Buffet just bought a 5 billion dollar chunk of Goldman Sachs, does this mean we have seen the bottom of this market?

Goldman Sachs CEO Lloyd Blankfein

globeandmail.com - Buffet Buys Into Goldman

"Goldman Sachs Group Inc. on Tuesday said it will receive a $5-billion (U.S.) investment from Warren Buffett's Berkshire Hathaway Inc., a vote of confidence for the Wall Street bank from perhaps the world's best-known investor" Reuters

Click on the read more icon for the full Globe & Mail Story.

I'm starting to think again about this government bailout of Wall Street. If you can't find someone to buy some equity or lend you some money without government involvement, and you are going broke without it, then you should go broke.


No matter who you are.

Privatized profits and losses.

Banks, insurance companies, private equity, and sovereign wealth funds are lining up to buy the pieces left over from anyone who can't make it.

Let them go under.

It's the American way, and in this case it would even be the right way.


read more | digg story

Hank Speak

I hope the only lesson learned here is not, if you are going to fail, make sure you fail so big we can't afford to have you fail.

Debt should not be used to increase your return on equity numbers, debt is bad, debt is dangerous, debt is to be avoided, always has been, always will be.

I find it odd that companies like Microsoft, that have no debt, grow revenue, grow net income, each and every quarter don't see there stock go up.

While their stock went no where for the last 5 years, leveraged home builders and investment banks saw there stock go through the roof.

For a while.

So now that people are a little "concerned" about their investment holdings a check on the amount of debt a company has may be an idea. I'm an old banker so it's always the first thing I look at.

One reason to check this now is the cost of borrowing is going up, way up, for everyone.

But the best reason to check the amount of debt on the balance sheet is, the last time I checked you can't go bankrupt if you don't have any debt.

Public companies have access to public equity, they don't really need alot of debt. They have taken it on over the past 10 years because it was cheap and they could boost their return on equity number with it.

It looks like those days are over.

Crude Oil Flounders

Oh wait that was me floundering. Is floundering a word? I'm sure it is cause I feel very flounderish.

39 winning ticks / 53 losing ticks = RR 0.74

The crude trade was offering alot of signals with retracement the theme of the day.

Our risk management rules shut me down early so we leave the day with a small loss and our dignity intact.

Look at all the lines on these charts, sheesh, what a mess.

13 Tick Crude Oil Renko Charts

9/22/2008

The Bull is Back, Maybe

Crude Oil Daily Chart


I wouldn't call the bull market until we see oil back up over the 3 EMAs ($117+ or so) on the daily chart. It has been quite a bounce since we saw oil in the $90s on the 16th of September.

The NYMEX October contract went limit up today, it was its last day of trading and had little volume as everyone was trading the November contract, so it really was not the benchmark to look at.

Today's trades on the 13 tick renko chart. Guess which one I didn't get filled on.

Isn't trading fun.

13 Tick Crude Oil Renko Bar Charts

9/20/2008

Markets Soar, but New Rules Upset Traders

Henny Ray Abrams/Associated Press
Michael O’Connor of Bank of America directed trading on Friday at his post on the floor of the New York Stock Exchange.
"After a week of escalating panic in the markets, stocks soared for the second consecutive day on Friday, and many investors rejoiced. But below the surface, a new sense of turmoil set in. When Washington changed the rules of Wall Street, winners were turned into losers and losers were turned into winners, and both camps were left fearful about what would come next." By VIKAS BAJAJ, ANDREW ROSS SORKIN and MICHAEL J. de la MERCED, NY Times

Click on the read more icon for the full NY Times story.


read more | digg story

9/19/2008

How the Energy Sector is Holding Up

Commodities, The Last Free Market?

Who is John Galt?

They're free for now, but it has become apparent that the rules can be changed at any time. Just make sure you are not short an investment bank when it happens.

I have moved my main chart back to the 13 tick renko. I know, I know, trade the plan moron.

I am using the 13 and the 8 tick the same way I used the 13 and the 5 tick charts.

With crude oil you need a larger time frame to follow the big picture. 13 seems to be the one. Less trading is better trading, for me. The signal must be there on the 13 tick chart first and then we can use the 8 tick for an entry point.

Crude is having alot of problems deciding what side of $100 it wants to live on. It's final thought for today was above $100.

13 Tick Crude Oil Renko Charts (click on charts to view)

Who Do You Love

I know, let's make stocks going down illegal.

I guess owning banks is now the safest investment in the United States. The government will not let them go under, the government will not let you short them, in fact I don't think you should be able to speak badly of them.

Does this remind anyone of bureaucrats gone wild, aka, Atlas Shrugged by Ayn Rand.

Is there an election going on some where?

Vast Bailout by U.S. Proposed in Bid to Stem Financial Crisis
"The head of the Treasury and the Federal Reserve began discussions on Thursday with Congressional leaders on what could become the biggest bailout in United States history."
Edmund L. Andrews, NY Times

Win McNamee/Getty Images
The Federal Reserve, with help from the Treasury Department, led by Henry Paulson, above, is taking more risk from markets.

Click on the read more icon for the full NY Times story.


read more | digg story

Who Do You Love, written by Bo Diddley

9/18/2008

Wild Crude Oil Trade

I had to get up early today, and have to leave work early as well, so I took some pre New York floor session trades.

I may have to get up at 5:00 am every day.

So far today crude can't make up its mind if it is a $100+ or a $100- product.

8 Tick Crude Oil Renko Chart (click on charts to view)

A New Role for the Fed: Investor of Last Resort

Susan Walsh/Associated Press
The Federal Reserve, led by Ben Bernanke, is being stretched.

WASHINGTON — "The mighty Federal Reserve is being stretched to its limits, both in the range of problems it is being asked to fix and in its financial firepower." By EDMUND L. ANDREWS NY Times

Click on the read more icon for the full NY Times story.


read more | digg story

9/17/2008

A Day to Remember

Some what of an interesting day in the markets. The U.S. government essentially buys AIG, my o my. Sounds kind of socialist, dare I say communist?

If the government is going to bail out companies then the government has the right to change the rules of the game going forward. Free enterprise is not going to be quite as free.

They should have let them go down.

Enough of that, I'll leave most of the Wall Street / U.S. government bashing to others and focus on the oil market.

I traded the 8 tick renko again today, and again had too many trades with 12.

I must admit I opened the 13 tick again and started looking. You should not trade if you are not sure of your time frame. So I'm in the trading plan dog house right now.

One time frame may not meet all market conditions, and watching both may be the way to go. The good thing is I'm not changing the plan other than the size of the renko bar. Too many trades to post charts, the total was 8 BE + 2s, 2 full stops, and 2 winners. 42 winning ticks / 29 losing ticks = RR of 1.45.

I hate it when the broker makes more money than me.

On another note I thought it would be interesting to see the difference between a regular candlestick daily chart and a renko daily chart. The renko looks alot easier to trade to me.

That is if you can live with the volatility and the size of stop required to stay with these types of swing trades.

Daily Crude Oil Chart


Daily Crude Oil Renko Chart


Don't miss the Warren Buffet post below. This is the guy who should have been running the U.S. treasury.

If the markets today have you feeling down watch the SNL post below, maybe you can have a laugh to help choke down your investment losses.

SNL

Just in case anyone on earth missed this. Very funny.

Buffett warns on investment 'time bomb'

BBC News: Click on the post title for the BBC News site.

It's ok Warren, go ahead, we deserve it, say it, say it.

I TOLD YOU SO.

Look at the date of this BBC article, March 4, 2003.

I'm sure there are earlier articles out there with Mr. Buffett saying the same thing.

"Derivatives are financial weapons of mass destruction." Warren Buffett

"The rapidly growing trade in derivatives poses a "mega-catastrophic risk" for the economy and most shares are still "too expensive", legendary investor Warren Buffett has warned.
The world's second-richest man made the comments in his famous and plain-spoken "annual letter to shareholders", excerpts of which have been published by Fortune magazine.

The derivatives market has exploded in recent years, with investment banks selling billions of dollars worth of these investments to clients as a way to off-load or manage market risk.

But Mr Buffett argues that such highly complex financial instruments are time bombs and "financial weapons of mass destruction" that could harm not only their buyers and sellers, but the whole economic system." BBC News

Click on the post title for the full BBC News story.

9/16/2008

Crude Oil Renko Charts

The combination of market volatility and the smaller tick value I'm using on the renko charts is providing more trades then I'm used to.

Once again the best move of the day happened around 5:00 am MST; I guess I need to get out of bed earlier.

10 Trades today, 6 break evens, 2 full stops, and 2 winners.

I have changed my break even off set to +2 instead of +1. This is mainly to help on the psychological side, as the idea moving the stop to break even + is to put you into a risk free position. With crude oil a stop at BE + 1 is not exactly "risk free" as slippage can be up to 5 ticks.

I don't know about you but I would rather look at the daily trade totals and see small positive numbers beside those break even trades instead of small negative numbers.

Patience and money management were the keys to insure this kind of day is positive.

61 winning ticks in the bank, 23 losing ticks out of the bank, makes for reward / risk ratio of 2.65. I'll take that ratio anytime.

Crude Oil 8 Tick Renko Bar Charts


The best part of the day is yet to come. The new season of House starts today!!

A sarcastic, wise cracking, self loathing, calculating know it all; what a great trader he would make. :)

Crude Oil Continues Decline

Jessica Rinaldi/Reuters
The Exxon Mobil refinery in Baytown, Tex., the nation’s largest, escaped Hurricane Ike with limited damage, but its sister refinery in Beaumont was flooded by the storm surge.


"Crude oil prices fell to $91.39 a barrel in early trading on Tuesday, after closing under the symbolic $100-a-barrel threshold on Monday." Jad Mouawad, NY Times

Click on the read more icon for the full NY Times story.
read more digg story


8 Tick Crude Oil Renko Chart

9/15/2008

Crude Oil Declines, Trading Below $100

(Spencer Platt/Getty Images)
Traders in the energy options pit of the New York Mercantile Exchange
"After more than six months in triple-digit territory, oil prices dropped sharply on Monday, falling under the symbolic $100-a-barrel threshold as financial woes raised concerns about a slowing economy and slackening oil demand. Oil futures in New York closed down $5.47, to $95.71 a barrel, their lowest level since February." JAD MOUAWAD NY Times

Click on the read more icon for the full NY Times story.
read more digg story

We Know Crude Will Go This Low

Daily Crude Oil Chart


Needless to say it was an interesting day in the markets. As I write this the DOW is down a couple of hundred ticks, Lehman Bros is bankrupt, Merrill Lynch has been purchased by Bank of America, AIG is in trouble, crude oil is down to $95, did I miss anything?

My focus stayed on crude oil, I have been looking at 8 tick renko bar charts for a while now, and traded them today. My rational is to focus on one chart rather than the 5 and 13 tick renko charts.

I always keep a 3 minute chart around, but today traded off the 8 tick renko. Results were mixed as the huge down move happened before the New York session opened. The floor session spent the day floating long and short with no real direction.

8 Tick Crude Oil Renko Bar Charts

9/14/2008

Crude Oil Under $100

Daily Crude Oil Chart (click on chart to view)


Even hurricanes have not been able to pull crude oil out of its downward trend. If the damage to oil production out of Texas proves to be not that severe, I would think that next week is going to be more of the same for crude oil.

Down.

Of course I'm prepared to follow whichever way it goes.

Refining is another issue, and it looks like higher gasoline prices will be here for a while. That's why I own my local gas station.

http://www.parkland.ca/internet/

If you need proof that refiners and gasoline retailers have not been gouging anyone in the recent past take at look at Parkland's Q2 results.

Here is a quote from their Q2 2008 quarterly report.

Margins

"The daily average spread between the price of crude oil and the posted gasoline rack
price at the refinery gate in Edmonton (refiners’ margin) was 9.9 cents per litre in the second quarter (9.4 cents per litre for six months) compared to 26.5 cents per litre in the second quarter of 2007 (19.4 cents per litre for six months). These variances affected those volumes where we share in the refiners’ margin under our supply contracts and reduced gross margins by approximately $30 million for Q2 2008 compared to Q2 2007 and by approximately $35 million for the six months ended June 30, 2008 relative to the six months ended June 30, 2007. The refiners’ margin for gasoline in the second quarter was 3.4 cents per litre lower than the annual average for the prior five years."

Of course there are a lot of folks who never let the truth get in the way of a good story.

9/11/2008

Crude Oil Trades

The NYMEX crude oil contract got close to $100 ($100.19) but stayed above the magic number for today. I hope the overnight trade doesn't take it below $100 because I want to be there if it happens.

Today's trading was ok with a winner, full stop, and a couple of break evens. Money management as always is the key. I can have a good day with 1 winning trade by limiting the losers quickly.

There is no free lunch as that same money management means I miss some moves due to tight stops and moving my stop to break even.

The second and third trades on the chart are examples of that.

You can't get everything. Or at least I can't.

13 Tick Crude Oil Renko Bar Chart (click on chart to view)

How Low Will Crude Oil Go?

I don't know.

However since this is the question on every one's mind I thought I would ask.

Maybe you can tell me?

As a intra day crude oil trader I don't really care.

As a oil and gas company stock holder I do care.

I only hold one direct producer, EnCana, which I do not intend on selling, and I am looking hard a purchasing another one, Canadian Oil Sands Trust.

It's always hard to buy when everyone else is selling, however a few wise folks tell me that is the key to making money in the stock market.

However those wise folk's cousins tell me never try to catch a falling knife.

I'll continue to mull it over while I wait for you to tell me how low crude will go.

http://www.cos-trust.com/
http://www.encana.com/

This daily chart pic was taken at 11:00 am MST, so far today crude has a low of $100.19.


9/09/2008

OPEC Says it Will Cut Production

Vladimir Weiss/Bloomberg News

Members of OPEC met Tuesday in Vienna to consider how to respond to a 30 percent drop in oil prices since July. Chakib Khelil is president of OPEC and Algeria's oil minister.


VIENNA — "In an unexpected decision made after a six-hour meeting that lasted well into the night, the OPEC oil cartel said it would reduce its oil production by about half a million barrels a day in a bid to stem a rapid decline in oil prices in recent weeks." Jad Mouawad, NY Times

Click on the read more icon for the full NY Times story.

Here is the jump after the OPEC production cut was announced.
No I was not trading it, I do have a life you know.

5 Tick Crude Oil Renko Bar Chart (click on chart to view)


read more digg story

The Truth About Oil & Gas

How did I miss this?

The story is a few months old but needs to be told.


Make sure you read the Why is Trading so Hard? post and comments!!

Crude Oil Charts

Crude oil sat around and did nothing today, and so did I.

Ok, not quite nothing, but close.

The trade chatting was more interesting than the trading, so read the last couple of posts prior to this one. This one only has boring charts.

OPEC seemed to be holding up the market as they met today to tell us they will continue to produce oil and the high prices were all my fault.

A break even, full stop, and small winner today. The big move came after the NY session closed and I exited my trade at the close.

So in case you can't add that up, I missed it.

13 Tick Crude Oil Renko Bar Chart


The daily chart shows us the new world of oil trading as we have seen the break that we talked about back on a August 26, 2008 post. http://tradingcrude.blogspot.com/2008/08/daily-crude-oil-chart.html

Daily Crude Oil Chart


If you are looking for some more interesting reading check out The Bing Blog in my blog list. Stanley is planning to have the U.S. "acquire" Canada.

9/08/2008

Another Cheery Peak Oil Video...

With a little conspiracy theory thrown in for good measure.

The one factor the peak oil doomsday folks don't talk about is demand destruction. We have seen evidence of this all ready at $140 dollar oil and $4.00 gasoline.

As prices move ever higher in a "peak oil" world demand will continue to drop, and as prices increase alternative energy supplies will increase.

These boys paint a very disturbing picture and I don't have the information to know if they are any where near the truth. Watch with an open mind as they could all be 100% wrong.

I don't buy the 911 connection and they certainly don't offer the other side of this story.

However I do think the world becomes a more dangerous place as the oil supply depletes.

9/07/2008

Why is Trading so Hard?

The stats we all hear and read state that 90 - 95% of all traders lose money.

How can this be?

Where do these stats come from?

If they are true then 5 - 10% of traders must be making a lot of money.

What are the factors that differentiate between the winning and losing traders?

Here's my list of winning attributes:

Well capitalized.
Patient
Disciplined
Committed
Understand money management.
Understand risk management.
Have documented their business and trading plan.
Emotional control.

Here's my list of losing attributes:

A need to be right.
Failure to take ownership of their decisions.
Trading as a hobby.
Addicted to gambling.

Obviously a lack of any of the strengths is a weakness as well.

What would you add to both lists?

When you look at these lists what attributes do you see in yourself?

For me the on the winning side it is patience, I find it hard to remain patient during the day as I want to catch every move.

On the losing side, it's the need to be right. This manifests itself in revenge trading, I can look back at my trading records and see a losing trade taken at say 9:15 and then I'm in again at 9:16 trying to prove I'm right and getting smacked again.

It's important to recognize your strengths and weaknesses and build safety nets into your trading plan to help you deal with the weaknesses.

Such as after X number of losing trades I must quit for the day. This is to force me to be patient as I know if I take another loser I'm done for the day. My trading plan also does not take very many trades in the day, I force myself to be patient and wait for a strong trend.

To mitigate my revenge trading I have rules on when I can re enter the market after a losing trade. I need to see a reversal of some of the technical indicators I watch and then have them come back to the trigger again.

If this doesn't happen and the move just keeps going, then it goes with out me.

Which I hate. :)

Cause it means I was right. :)

Of course I knew that. :)

Again, look at the 2 lists of attributes and if you can think of any I'm missing make a comment so I can have a look.

Thanks

9/05/2008

What is This Blog For?

I received another email from someone requesting my "trading system".

This begs the question, what is this blog for?

Hmmm.

The blog started as I thought it may be helpful to other traders to see some of my original business plan. (see posts from March & April).

It then morphed as I am a bit of a news junkie and thought why not compile some of the oil related news stories I see in one place for those who share the same interests.

The last reason for the blog is to show how I trade the crude oil market on a daily basis. I learned to trade by watching others, reading, reading, and reading some more.

Then after all that you lose money and start over.

The main benefit to me from the blog is the daily review of the market and the trades I took in that market.

My hope is others find this interesting, useful, and at time humorous.

What the blog is not is an attempt by me to convince you to trade exactly the way I trade.

If you do take any part of how I trade and adapt it to your own trading system that's great.

But I will stand on the theme of the repeat post below: YOU CANNOT TRADE SOMEONE ELSE'S SYSTEM.

This post was originally published April 4, 2008

How to Trade?

Many people in the "trading" business are willing to sell you their trading system. This begs the obvious question, if the system is so good why would they sell it?

Even if the system is valid the vast majority of people would not make money trading it.

Why?

Because they will inevitably deviate from the system.

Why?

You must trade your own beliefs in the market, not someone else's. This failure to follow occurs whenever there is a drawdown in someone else’s system that you are trying to trade.

Trading is money and money is emotion and when these emotions are put to the fire you will fail if you are not dealing with your own belief system. In order to stick with “the plan” in a drawdown you must believe in your plan and this belief can only come from the very core of who you are and your psychological relationship with your money at risk in the marketplace.

You must develop, design, and build your own system based on your own research. You can then build a database of trades that provide the trader a statistical basis on which they validate their trading system.

Then you try and sell it to others. :)

Exciting Crude Oil Trades....

are hopefully down the road.

Not much happening in the crude oil trade today. There was a nice short move and I took two cracks at it but wound up with two break even trades.

The first trade today was a long and a mistake, one of those you look back on and say what the..... were you thinking. Full stop on that one of course.

All in all the week was positive and we look forward to Monday.

13 Tick Crude Oil Renko Bar Chart (click on chart to view)

As Oil Prices Fall, OPEC Faces a Balancing Act

"For oil producers that have grown accustomed to rising revenues, falling oil prices are turning into a cause for concern, if not quite panic." Jad Mouawad, NY Times

Click on the read more icon for the full NY Times story.


read more | digg story

Oil: A Trader's Market

I don't know if this guy knows anything about the crude oil market, but the key point here is, he looks like he knows.

9/04/2008

Crude Oil Renko Chart

The inventory report was moved to 9:00 am MST, and we were paid to wait. Classic set up on the 13 tick renko bar chart and we held to the ADX color change.

Have to end early today, so we take our one winning trade, put it in the bank, and go home happy.

13 Tick Renko Crude Oil Chart (click on chart to view)

Why cheaper oil signals trouble

A little reading while I wait for the oil inventory report.

Inflation appears less menacing, but the U.S. export boom could soon face strong headwinds.
By Colin Barr, senior writer

NEW YORK (Fortune) -- The commodities bubble appears to have popped, but keep the champagne on ice.

Click on the read more icon for the full Fortune story.


read more digg story

9/03/2008

Ten Market Rules to Remember

Ten Market Rules to Remember by Bob Farrell

1. Markets tend to return to the mean over time.
2. Excesses in one direction will lead to an opposite excess in the other direction.
3. There are no new eras -- excesses are never permanent.
4. Exponential rapidly rising or falling markets usually go further than you think, but they do not correct by going sideways.
5. The public buys the most at the top and the least at the bottom.
6. Fear and greed are stronger than long-term resolve.
7. Markets are strongest when they are broad and weakest when they narrow to a handful of blue-chip names.
8. Bear markets have three stages -- sharp down, reflexive rebound and a drawn-out fundamental downtrend.
9. When all the experts and forecasts agree -- something else is going to happen.
10. Bull markets are more fun than bear markets.

Bob Farrell was the chief stock market analyst at Merrill Lynch for decades. He has seen all types of markets and his 10 market rules are considered classic investment advice.

Interesting to apply some of his thoughts to the crude oil market of today.

Buy Low, Sell High

Nothing happening for me today in the crude oil market. The oil inventory report has been moved to Thursday due to the Labour day holiday, so hopefully that gets the market moving.

This is an interesting read, smart people making good decisions.

Jamie Dimon's swat team
How J.P. Morgan's CEO and his crew are helping the big bank beat the credit crunch.
By Shawn Tully, editor at large

"Dimon and his team are on top today because they took a daring stance at the height of the credit bubble. J.P. Morgan mostly exited the business of securitizing subprime mortgages when it was still booming, shunning now notorious instruments such as SIVs (structured investment vehicles) and CDOs."

Click on the read more icon for the full Fortune story.
read more digg story

RISK


Ospraie fund to close after 27 per cent slide

NEW YORK — "Hedge fund manager Ospraie Management LLC will close its flagship fund after it plunged 27 per cent in August on losses in energy, mining and natural resources equity holdings, in one of the biggest ever closures of a commodities-focused hedge fund." PARITOSH BANSAL Reuters

People love to point out the huge returns that have been made in hedge funds, along with the fees hedge fund managers have made over the past few years. One can never forget that those returns are earned by taking on a large amount of risk.

Sometimes the risk comes around and bites you in the rear.

Click on the read more icon for the full Globe & Mail story.


read more digg story

9/02/2008

Oil price of $100 a barrel on horizon

"Oil prices sank to a five-month low of just more than $105 a barrel on Tuesday as traders turned their sights on signs that slower growth was spreading beyond the US into Europe, Japan and even emerging markets." Financial Times, By Javier Blas and Carola Hoyos in London and Michael Mackenzie in New York

Click on the read more icon for the full Financial Times story.


read more | digg story

In Trading Hope is a Four Letter Word

Let's see my quote as of 6:51 am was, "hopefully the best trading is not done for the day".

Right.

Nine signals in the day, I took the first 6 and then quit with 4 BE + 1s, 1 full stop, and 1 partial stop.

The crude oil contract came close to going limit down this morning, but then spent the rest of the day slowly grinding upward.

In case your wondering what happens to crude oil if it goes limit up or down, I revisited that scenario this morning.

Maximum Daily Price Fluctuation

"$10.00 per barrel ($10,000 per contract) for all months. If any contract is traded, bid, or offered at the limit for five minutes, trading is halted for five minutes. When trading resumes, the limit is expanded by $10.00 per barrel in either direction. If another halt were triggered, the market would continue to be expanded by $10.00 per barrel in either direction after each successive five-minute trading halt. There will be no maximum price fluctuation limits during any one trading session." Source: NYMEX Web Site

Our risk management kept us safe and we shall see where we go tomorrow.

$100 oil is not far away.

13 Tick Renko Crude Oil Charts (click on chart to view)

Crude Oil Breaks $110

This looks interesting.

Hopefully the best trading is not done for the day.

Daily Crude Oil Chart