Showing posts with label crude oil trade. Show all posts

2/05/2010

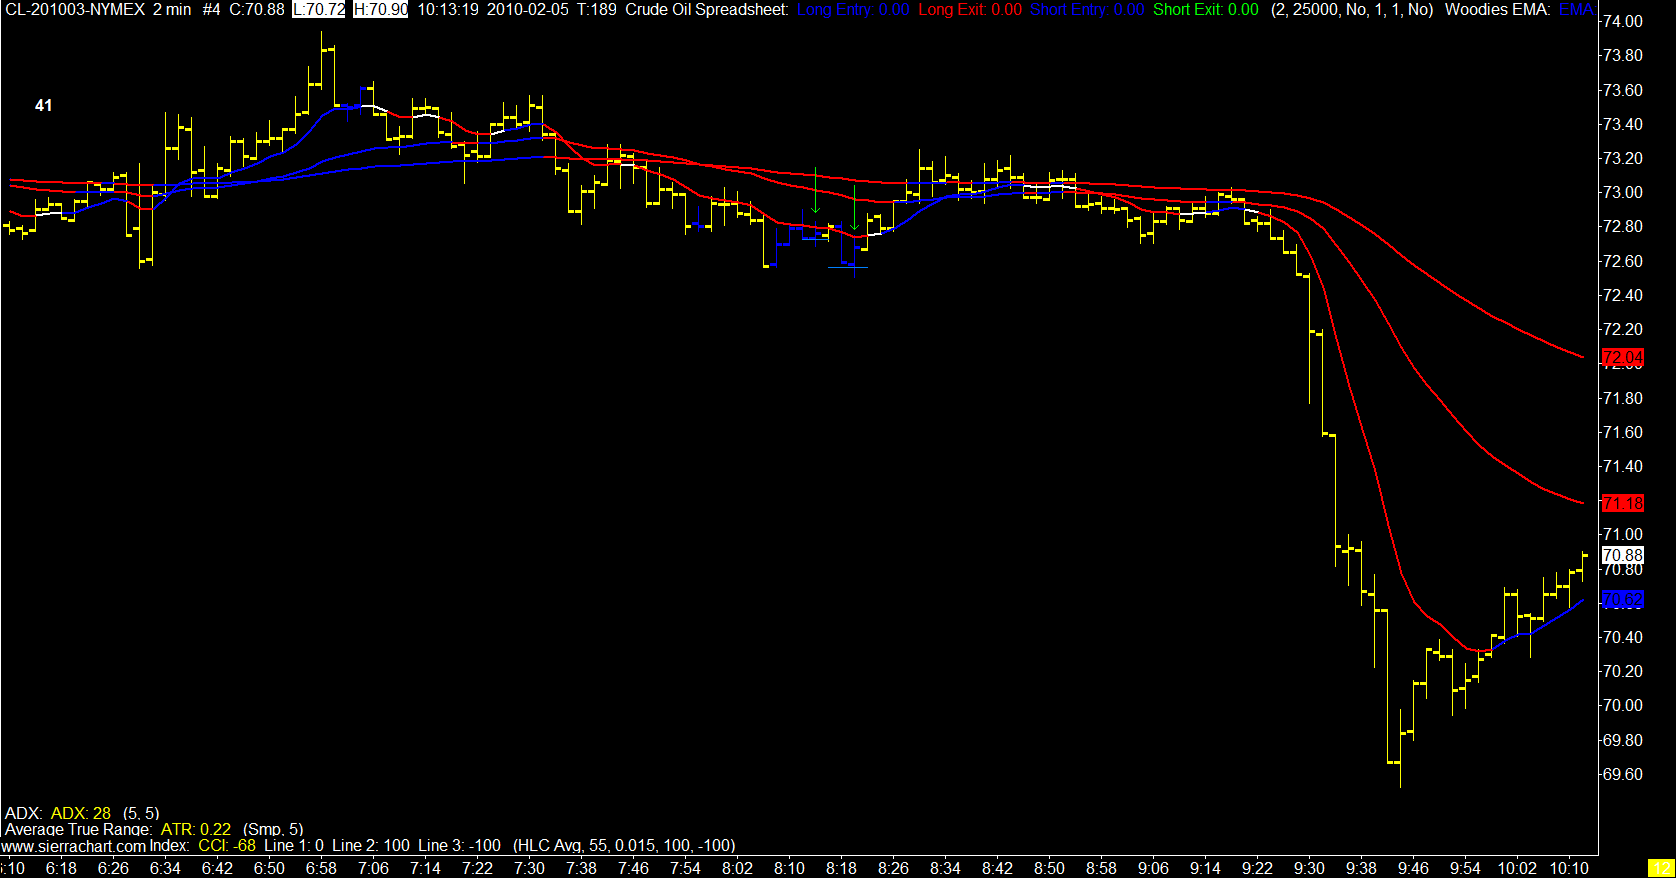
The Ship Sailed Without Me


We were steaming along quietly and then all of a sudden the sea got a Little rough.


2 Minute Crude oil Chart

Humbug!

3/16/2009

One of Those Days

In my perusal of trading blogs today I see a familiar theme. Most of which I won't repeat here as this is a G rated blog. My results were the same.

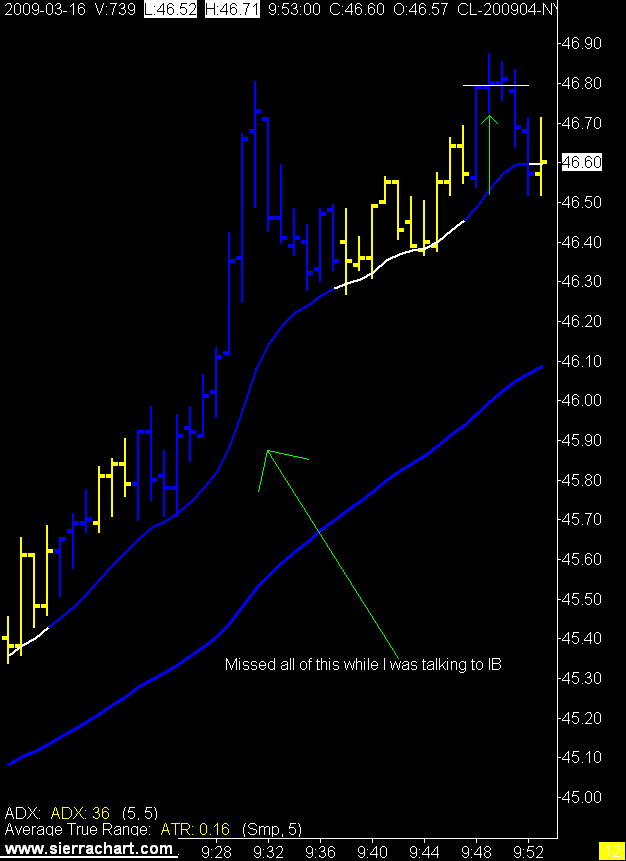
IB went strange on me right out the gate, a sign perhaps, I should have shut it down right there. As soon as I entered the first order the April contract disappeared off my IB screen. Everything froze up and when it came back to life I was stopped out. Needless to say I had a conversation with IB, and of course the market took off while I was talking. When I got back to the trade I took the next signal and got smacked again.

The smartest thing I did all day was quit trading right there and then.

In case you're wondering on the first chart below yes I do see where I should have entered. Like I said it was one of those days.

1 Minute Crude Oil Charts


Not sure if you remember I purchased some stock back on March 3, 2009. I have placed sell on stop limit orders on all 3 stocks at the break even point. I'm up 9%, 5%, and 2% on the 3 stocks I purchased.

Certainly could get stopped on the intra day whip on that +2% one. We shall see.

I have never used stops on my stock portfolio as my investing has always been done on 100% fundamental analysis. My thought patterns on investing have always been if it was a good buy at $10.00 its a great buy at $8.00.

After this stock market meltdown, I've decided I don't want to own "new" stocks that are going the wrong way. So with this little rally under these three the break even stop limit order is in. The worst thing that can happen is I get my cash back.

I can live with that.
2/19/2009

Crude Oil Contango Explained

Not by me.

The EIT (Exceptional Irish Trader) sent me the link, is that an Irish accent in the video?

Hmmmm.


10/06/2008

Market Meltdown!!!

Sorry, just thought I would add some fuel to the flames. Actually I was part of the solution today as I was not selling anything, in fact I was buying stock today.

However in the crude oil market I was selling.

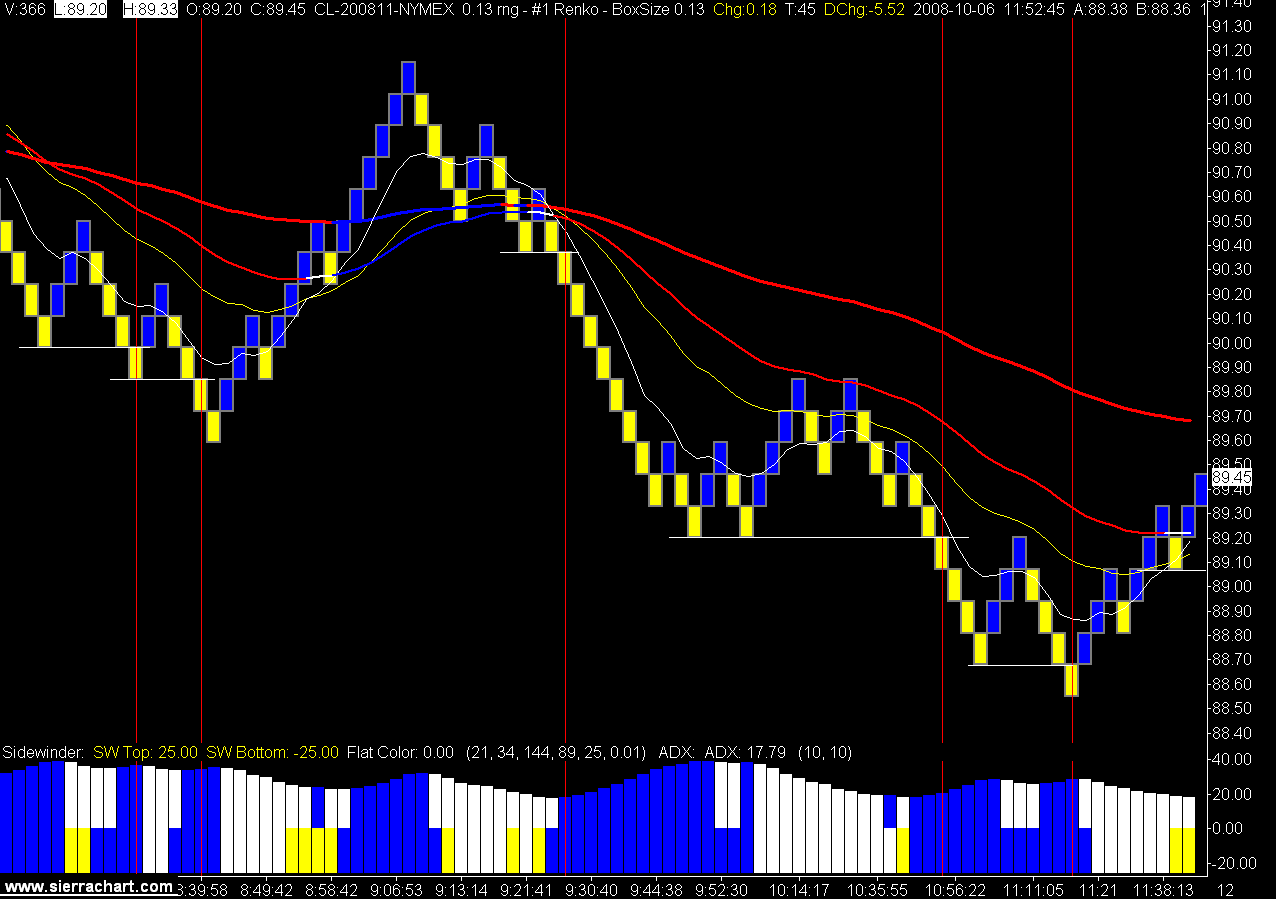
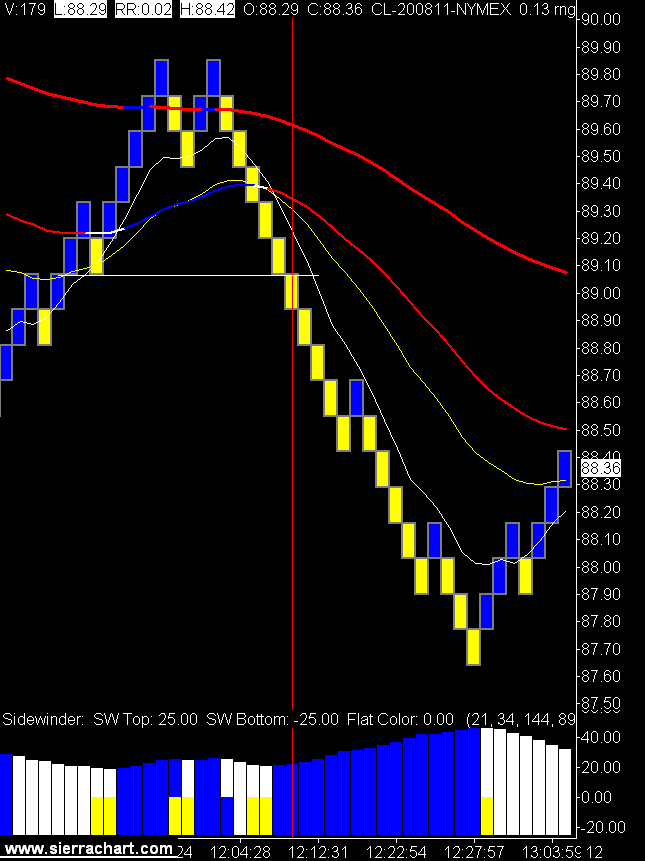
We broke $90.00 today and I don't see a floor anywhere, so stop asking me how low will crude oil go.

Daily Crude Oil Chart (click on charts to view)


13 Tick Crude Oil Renko Bar Charts

8/15/2008

Crude Oil Heading Down to $........

Not much happening for me in the trading yesterday, the signals had initial movement but then retraced for break even stops.

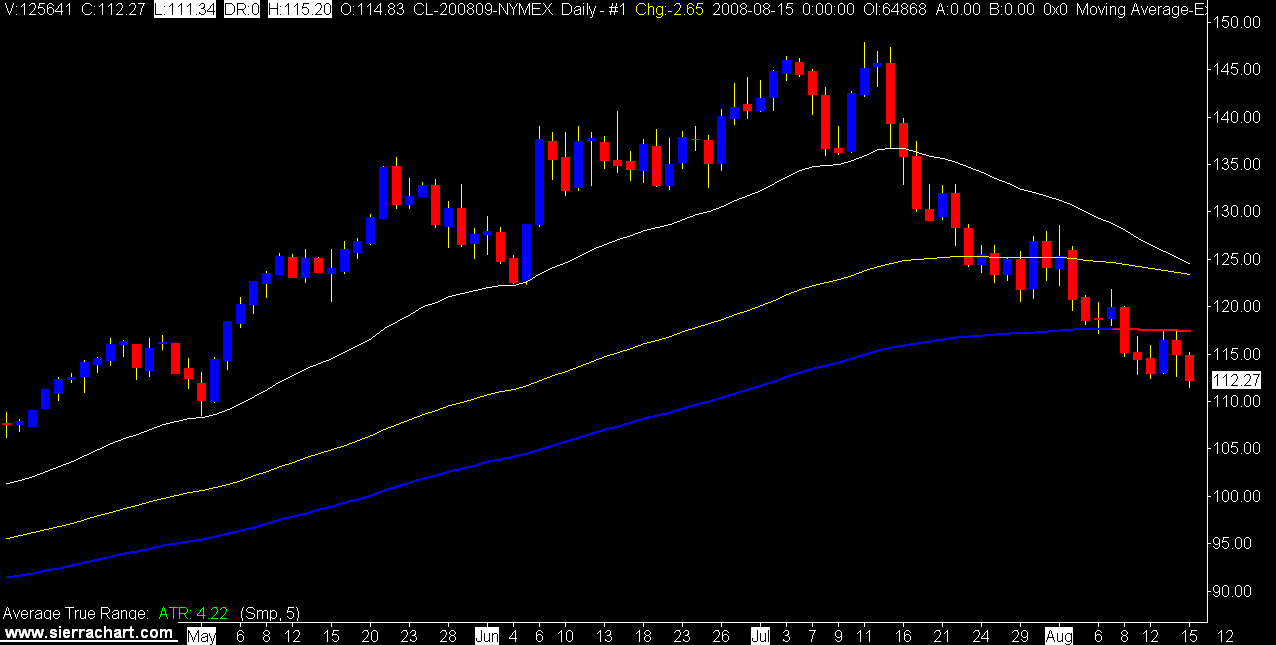
The daily chart has an interesting look with the 144EMA breached, than a double retouch of the 144, and then today a new lower low.

This could make for an entertaining ride next week.

If you swing trade this is interesting, if you day trade it is not interesting, if you don't trade at all you're just confused.

Crude Oil Daily Chart (click on chart to view)

6/25/2008

Trading Crude Oil

The market was anticipating a build up of crude oil inventory this week as refiners are not all that keen on buying $136 oil. They cannot sell the refined product at a decent profit.

That's right, the price of gasoline should actually be higher based on the price of crude oil.

Why isn't it?

Count the number of gas stations in your neighborhood. There are simply too many and the competition is fierce. They really only make money selling all the "junk" in the store, not by selling gasoline.

Anyway back to the trading, in this case the pre inventory report guessing was correct as the price just kept falling after the report was released.

Nice day to trade.

6/05/2008

Crude Oil Rises Again

The bull is back.

Crude oil was up over five dollars today with the NYMEX close around $128.00.

The momentum in the long trades was powerful in the afternoon session. This was in sharp contrast to the slow short side declines we have seen for the past week or so.

You'll notice my chart looks a little different today as I am trying to eliminate some redundant indicators to simplify the look and reaction time required in reading the chart.

Simple is always good.
13 Tick Range Bar Chart (click on chart to view)

The daily crude oil chart shows a nice bounce off the 34 EMA (white line) and back to the long bull trend.

Daily Chart