Prepare to be Wrong
8/26/2008
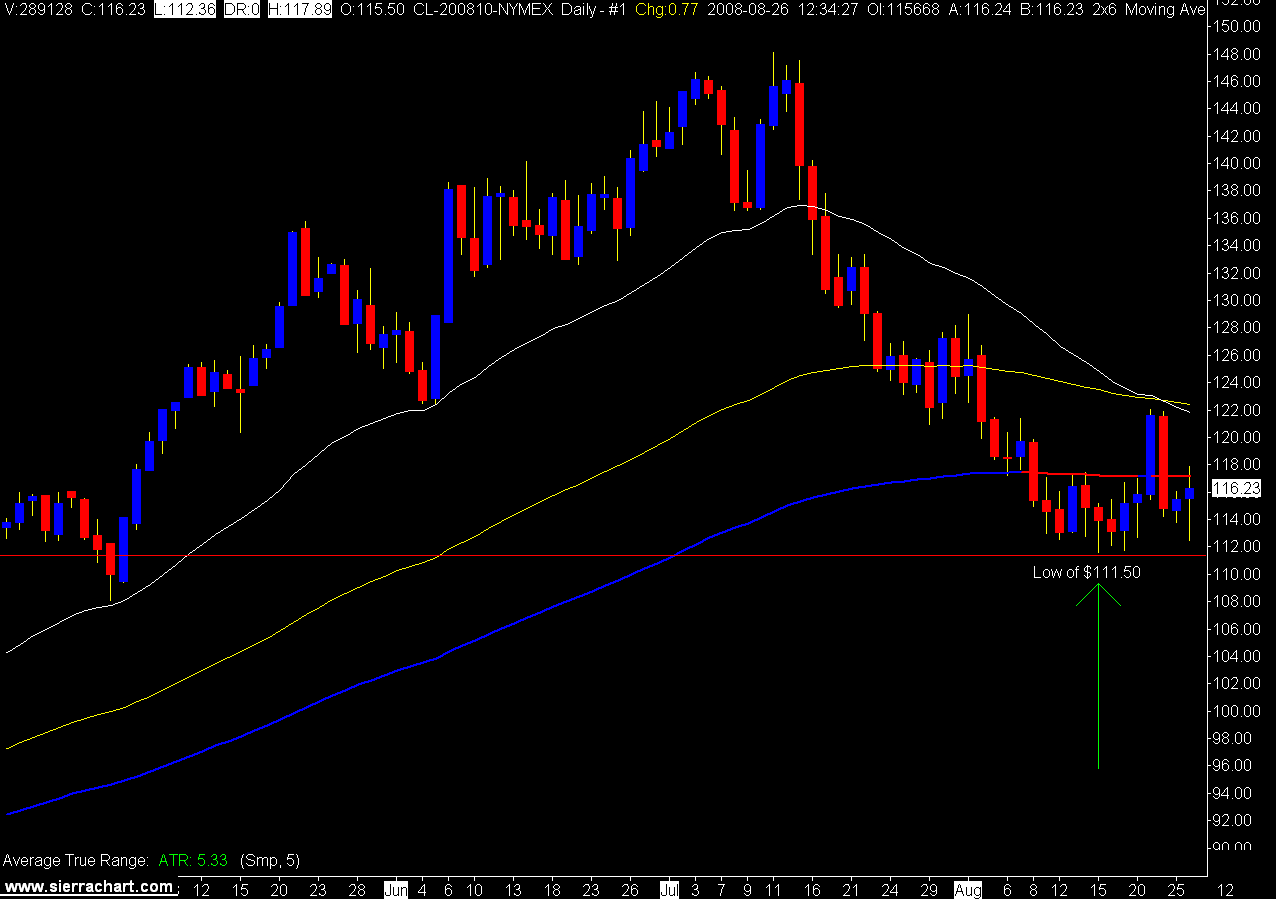
Daily Crude Oil Chart
We are seeing a real period of consolidation on the daily chart, and with the exception of Aug 21 and 22 we are stuck in a range around the 144 EMA.
It will be interesting to see what happens on the downside if the $111.50 low of Aug 15 is breached.
That would be pushing crude down to prices not seen since May.
Daily NYMEX Light Sweet Crude Oil Chart
No comments:
Post a Comment
Newer Post
Older Post
Home
Subscribe to:
Post Comments (Atom)
No comments:
Post a Comment