A continual move in one direction. For how long? How steep? How fast?
You get the point, everyone (well almost) wants to trade with the trend but everyone would probably call the trend differently. The big monster moves are easy to see, at least once they've happened they're easy to see.
That's the trick, we trade the "hard right edge" of the chart. All gurus and system salesmen can point to their perfect entry points on a static chart, but try trading it live.
The point of this post, if there is one, is why do I use so many different, or redundant depending on your view, indicators. Sometimes I wonder myself. I had the CCI programmed into my blue bars for a while and then discovered that every signal I had happened with or without my CCI criteria. In other words, for me, the CCI was a redundant indicator so I got rid of it.
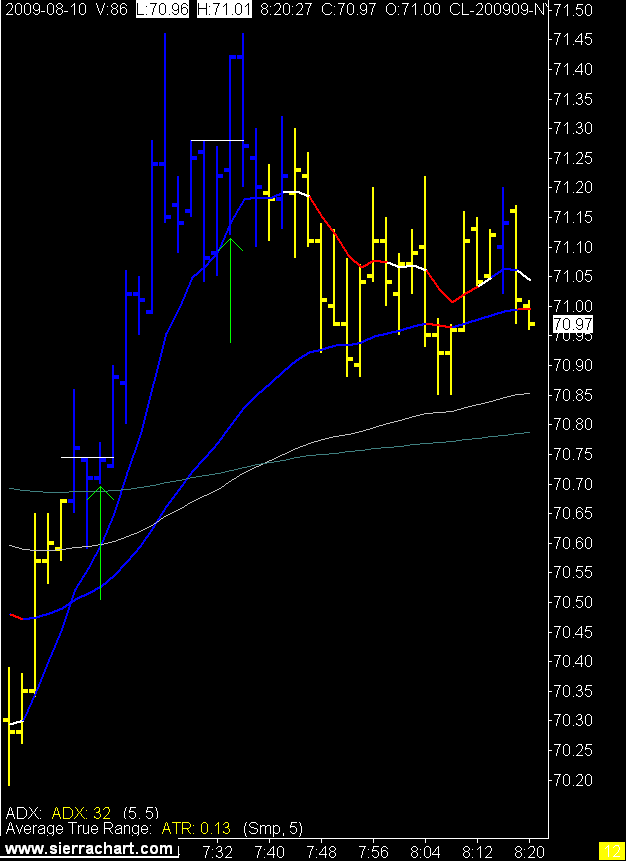
Today was a strange day in crude oil as there was lots of volume and some nice moves but everything seemed to happen in slow motion. The indicator that picked that up the best today was the ADX. The ADX is the one indicator that I have sometimes wondered about, wondered if it was redundant for me.
Tis not.
It also got me wondering what the heck is it. Gasp you say. He doesn't know, I'm getting a new guru!
Well I'm not your guru and I have the definition written down in my plan but as I sit here I can't really remember what it is. J Welles Wilder invented it, along with the ATR and many others. I still haven't looked now, from what I remember it is just an average of Wilder's DMI lines. Hmmm that does beg another question now doesn't it.
Ok I'll look it up, back in a sec.
Read it for yourself. Read some more here.
I pretty much knew all that, still not sure what the DMI lines are, moving averages of some sort I guess.
Anyway the ADX worked well today and either kept me flat or warned me to tighten stops. I say it was the ADX today because the other indicators looked strong at times. ATR wasn't through the roof but was there, the EMAs had good angles, just the ADX said, wait a tic here boss.
I listened and the day was positive. One good trade, one stop, and many break evens.
2 Minute CL Chart
9 comments:
Swami, can you expound on the significant ADX level that signals a trend is in the offing?
In a word, no.
Reason being as I said I'm not a guru. The time frame, chart type, ADX setting, etc all make a difference.
All I can say is I have found it to be useful. Others who trade close to me say it's too slow.
You have to find your own way. It's the only way that will work for you.
Thank gawd. I would have lost a little respect for you if you had just handed out the goods! LOL
Merging two topics (the usefulness or otherwise of indicators and the 'Swami' comment above), a story...
-------------------------------------
A MAN BOARDED a train for Delhi and sat across from a swami. The swami was uttering all sorts of incantations and taking dust from a bag and throwing it into the air. Unable to suppress his curiosity, the man finally asked the swami what he was doing.
"I am protecting this railcar from tigers with my special tiger dust," replied the swami.
"But," the man protested, "there aren't any tigers within a thousand miles of us!"
And the swami said, "Effective, isn't it?"
--------------------------------
I would argue that (for many, very often) it is the same with indicators :-)
L & W that is an interesting story, strange but interesting.
I however have found that since I started slaughtering oxen and reading the entrails my trading has improved dramatically.
I am willing to share my entrails findings with you. For a small fee of course.
ADX is a little tricky to read. I would recommend Dr. Alexander Elder's "Trading for a Living" for a nice explanation of how to read it. Basically, the +DMI and -DMI will tell you the direction of directional movement of candles, or the amount of price above (+DMI) or below (-DMI) previous candles. The theory is that, in trends, candles tend to be more outside of previous candles in the direction of the trend than against the direction of the trend. This should be pretty obvious.
The best way to read ADX is to wait until the ADX line goes "dormant" and lies low for a while. Then, if the ADX makes an upmove for a few points (let's say 7 or more depending), that is the "signal" that a new trend is being born. You'll want to trade long if +DMI is on top, and you'll want to trade short if -DMI is on top. So basically, wait for ADX to go low and then turn up. When it does, trade in the direction of whatever DMI is on top.
Hope that helps.
Thank you mikeanthony for the DMI lines explanation. That helps me get it.
The way to read or trade the ADX is of no interest to me. :) But maybe to others. :)
LOL! Boy, you're ungrateful Solfest. But still funny and extremely lovable.
Ungrateful??
What, I said thank you. I guess I am so focused on where I am at trading right now that any other thoughts/strategies are of no interest to me. I just can't hide that.
Maybe I'm being short sighted.
Naw I'm just right. haha
Post a Comment