Showing posts with label ADX. Show all posts

8/10/2009

A Trend is.....

A trend is defined as.... what?

A continual move in one direction. For how long? How steep? How fast?

You get the point, everyone (well almost) wants to trade with the trend but everyone would probably call the trend differently. The big monster moves are easy to see, at least once they've happened they're easy to see.

That's the trick, we trade the "hard right edge" of the chart. All gurus and system salesmen can point to their perfect entry points on a static chart, but try trading it live.

The point of this post, if there is one, is why do I use so many different, or redundant depending on your view, indicators. Sometimes I wonder myself. I had the CCI programmed into my blue bars for a while and then discovered that every signal I had happened with or without my CCI criteria. In other words, for me, the CCI was a redundant indicator so I got rid of it.

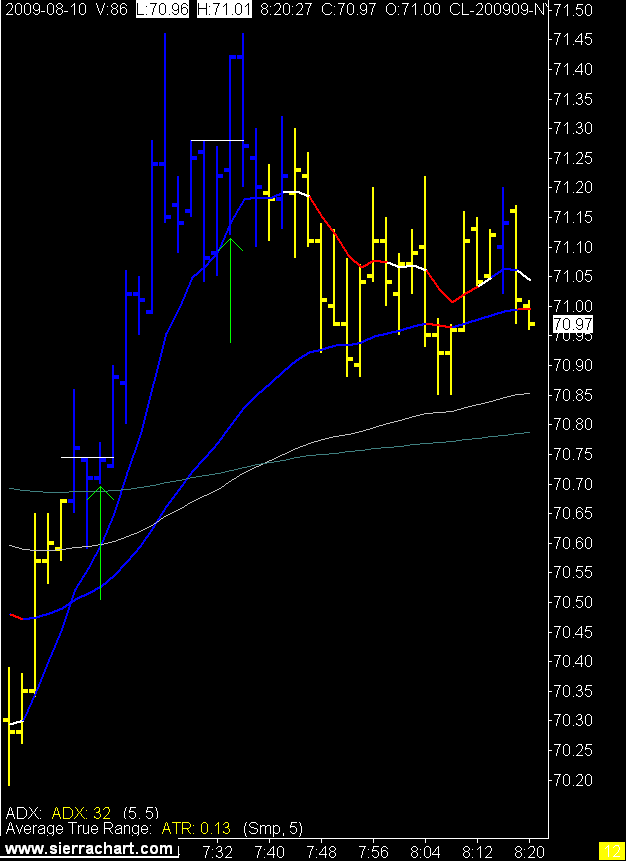
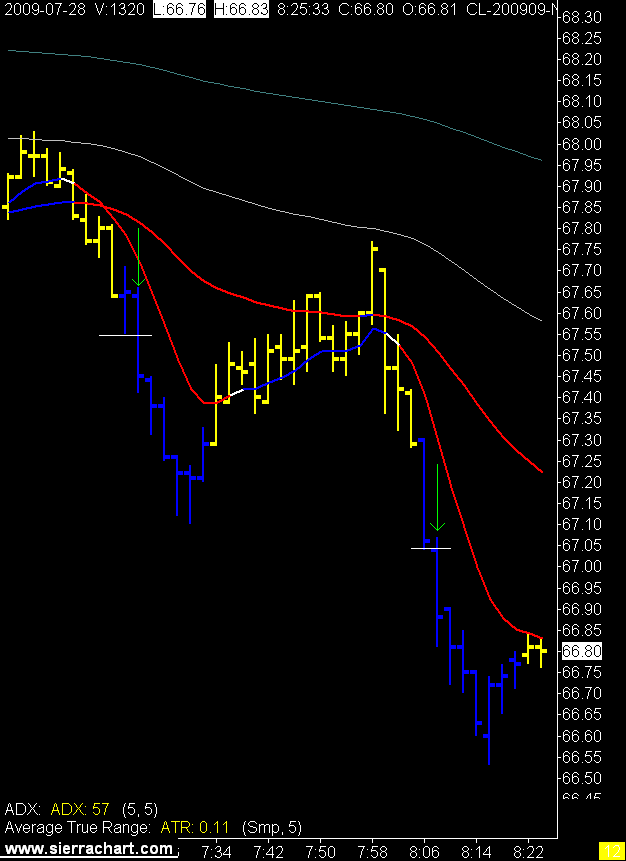
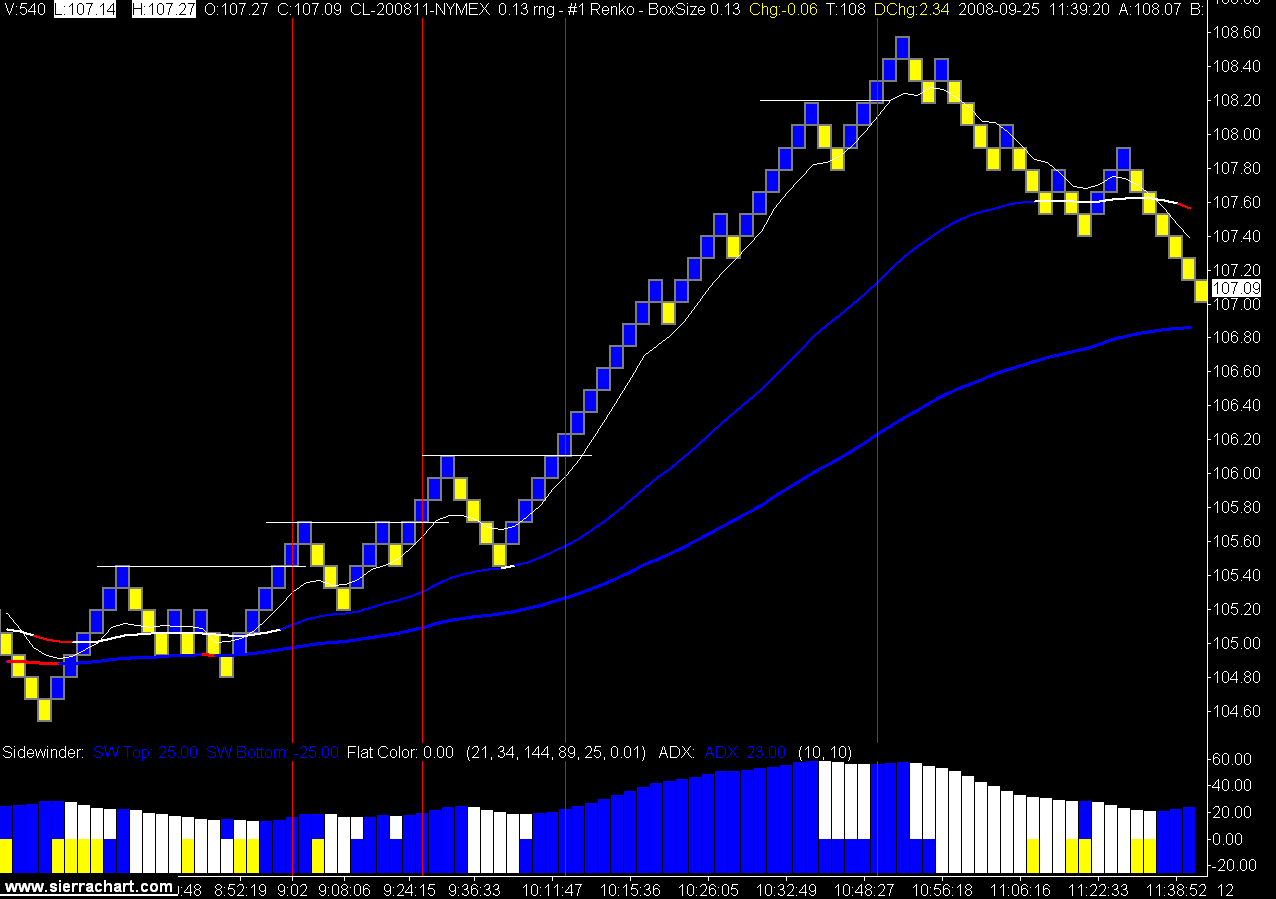
Today was a strange day in crude oil as there was lots of volume and some nice moves but everything seemed to happen in slow motion. The indicator that picked that up the best today was the ADX. The ADX is the one indicator that I have sometimes wondered about, wondered if it was redundant for me.

Tis not.

It also got me wondering what the heck is it. Gasp you say. He doesn't know, I'm getting a new guru!

Well I'm not your guru and I have the definition written down in my plan but as I sit here I can't really remember what it is. J Welles Wilder invented it, along with the ATR and many others. I still haven't looked now, from what I remember it is just an average of Wilder's DMI lines. Hmmm that does beg another question now doesn't it.

Ok I'll look it up, back in a sec.

Read it for yourself. Read some more here.

I pretty much knew all that, still not sure what the DMI lines are, moving averages of some sort I guess.

Anyway the ADX worked well today and either kept me flat or warned me to tighten stops. I say it was the ADX today because the other indicators looked strong at times. ATR wasn't through the roof but was there, the EMAs had good angles, just the ADX said, wait a tic here boss.

I listened and the day was positive. One good trade, one stop, and many break evens.

2 Minute CL Chart

8/03/2009

Renko Bars and Range Bars

WARNING: This post is very long and has no pictures. If this alarms you skip down to the next post which has few words and shiny pictures of charts.

Pandu the FX trader from Australia asked me this on an old post.

"I want to know what do you mean by 'The hard stop value is set as a % of the range bar we are trading.'. What is the meaning of 'Range Bar'? Also, what parameters do you use for the ADX you use?"

So that along with all the google searches for renko bar trading I get on this blog I thought I should take a moment and discuss why I quit using range bars and or renko bars.

In a word, time.

We all have access to the same data, we all live in the same space and time continuum. I heard that on Star Trek I think.

I don't move the market. I want to be looking at what most everyone else is looking at. Why? Because I'm going to ride along with whomever, collectively or all by themselves, does move the market.

So we're all looking at price move and we are all breaking down that price action with different methods. We have volume, time, and tick data and all of it tracks the same price but presents the trader bar closes in different ways. I want to look at the chart picture with the method, time, that I think most other traders are using. Note I said think, not know.

Of course everyone who uses one of those categories thinks it is the best. Until they change, just like I have. :)

Back to Pandu's question. The range bar measures a set range of price movements and when that range is met the bar prints.

A renko bar does the same except the range has to be all in one direction for the bar to print. So with a 10 tick renko bar the range has to be all up or all down for it to print. A 10 tick range bar could open at 70.25 and have 5 ticks up to 70.30 and 5 ticks down to 70.20 and the bar would print. A 10 tick renko bar would have to have 10 ticks up to 70.35 or 10 ticks down to 70.15 before it would print.
There are other little nuances to them both depending on your chart service but I'm not going into that here.

Got it? I hope so it exhausted me explaining it.

So the benefits to both are when price moves quickly the bars start printing. We need the bars to print in order for our indicators to, well, indicate. It may be a shock for some but all our indicators are lagging. Sorry. They need the price bars to move in order for them to do their "magic".

This all sounds good and works for many people, like the man who loves rain (Rainwater) and really wants to be included in Jules private blog but is too shy to ask. (Rainwater uses range bars not renko bars)

Actually it sounds so good it's making me wonder why I gave them up?

Renko, I gave up because there can be too much intra bar movement and it is too hard to find your way in with renko alone. I started using time charts with renko and then eventually just dumped the renko. Renko charts are great for keeping you in a trade and could be used for a technical exit, but then I started trading for a target rather than a technical exit so renko went bye bye.

Range bars are probably of more use but I found they gave me too many false starts and I need to control my pushy the button fingers.

I control them with time.

Time, I have to wait. I use 1 and 2 minute bars so I don't wait for long but for me, let me say again, for me, I find that time works the best.

Am I late sometimes? Yes. I give that up in order to stay out of some false moves.

So there it is, my trading still looks at range via the ATR, I need to see some movement in one direction via the ADX, I need price on the right side of the EMA's, I look for a higher high or lower low and away we go.

The longer multiple EMAs are there to simulate what a longer term chart would be showing in terms of trend and direction. Like a 5 and 15 minute chart or so.

This is a very long post with no pictures which may be alarming to some. I better place a warning at the top of this post.

Oh yes the rest of Pandu's questions. My stop on the range or renko bar was a % of the bar I was using. So for a 20 tick range bar I may use 75% of that as a stop, 15 ticks. With the ADX and ATR I am looking for a minimum threshold to be met before I start looking for signals. That's all.

P.S. Those renko bar charts were sure pretty.

Home

7/28/2009

Change

I did peek a little at charts while on holidays, which was a mistake, and found myself squinting at little charts on my laptop. This got me to thinking about getting the CL trading down to one chart instead of two.

I only use the one minute chart for soybeans but have found with crude oil I need to see trend and range on both the three and one minute charts in order to stay out of trouble. Besides having to watch two charts I have also found that when I see blue on one of the charts I want to hit the button rather than waiting for conformation from the second chart.

So being the quantitative genius that I am I added one minute to three minutes, divided by two and came up with a 2 minute chart.

Still playing with the ADX and ATR settings but found a couple of nice trades today. The trend was so strong this morning blind monkeys could have made money today. Only time will tell if the settings will keep me out of the flats and in the trends.

2 Minute Crude Oil Chart

5/01/2008

Trade the Plan

How do you have a $500.00 winning crude oil trade and feel like an idiot?

By not following your plan and missing the $930.00 that came after your brilliant exit.

The trader in charge (me) was watching the 8 EMA and the CCI 100 line cross and came to conclusion that he should move his stop to protect profit.

The ADX, who is not in charge, said there could be some more downside here, lets hang on until I turn white. Which is how the trading plan is written based on hundreds of trades showing that this is the best exit.

I don't mind leaving money on the table when it happens within the confines of the trading plan, but when I deviate from the plan and it costs me money... well let's just say I was not happy.

The plan and the ADX were right.

The trader in charge (me) was wrong.

Trade the Plan.


(click on chart for better view)