I believe I may have fearlessly predicted the top in crude oil on April 24, 2008, with oil trading well under $120.00.
So with that enviable track record on crude oil price predictions I shall not venture there again.
I will however, mention the daily candle formation today known as a doji. This particular candle formation is supposed to mean a change in direction is possible.
But I will make no such prediction.
The downward moves today were wild and fast, but by the end of the day price had crawled back up to finish basically flat on the day.
I'm glad I don't have to make that direction call, as every day, day after day, I just trade what I see.
Daily Crude Oil Chart (click on chart to view)

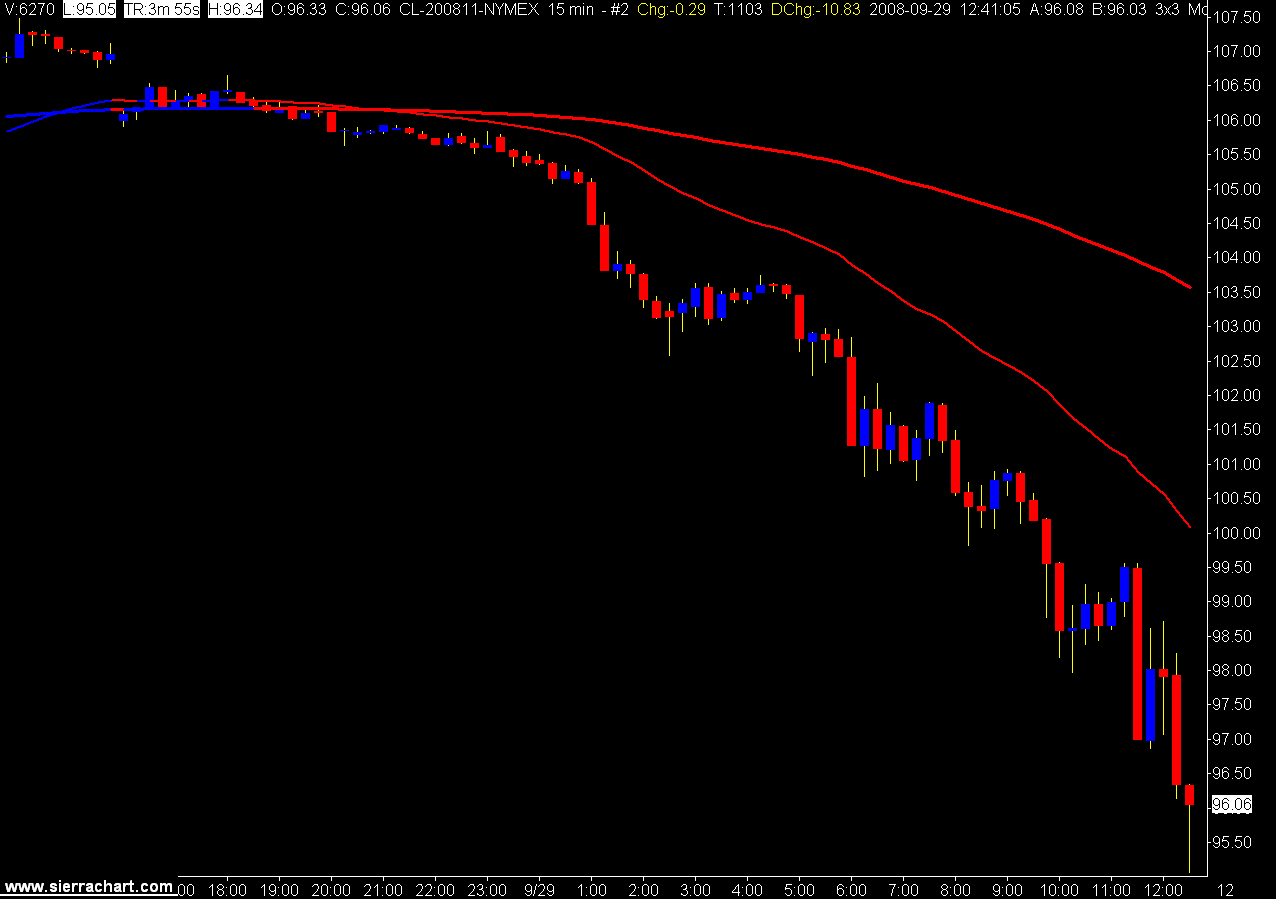
15 Minute Crude oil Chart

Since corn is now considered a fuel I thought I would take a look at the July corn daily chart. We also see a doji candle on May 9th and then see price moving down and through the 34 EMA.
All interesting items to note, but to place a long term trade to the short side in either crude oil or corn would take some courage at this time.
Eventually what goes up comes down.
The question remains when.
Daily Corn Chart