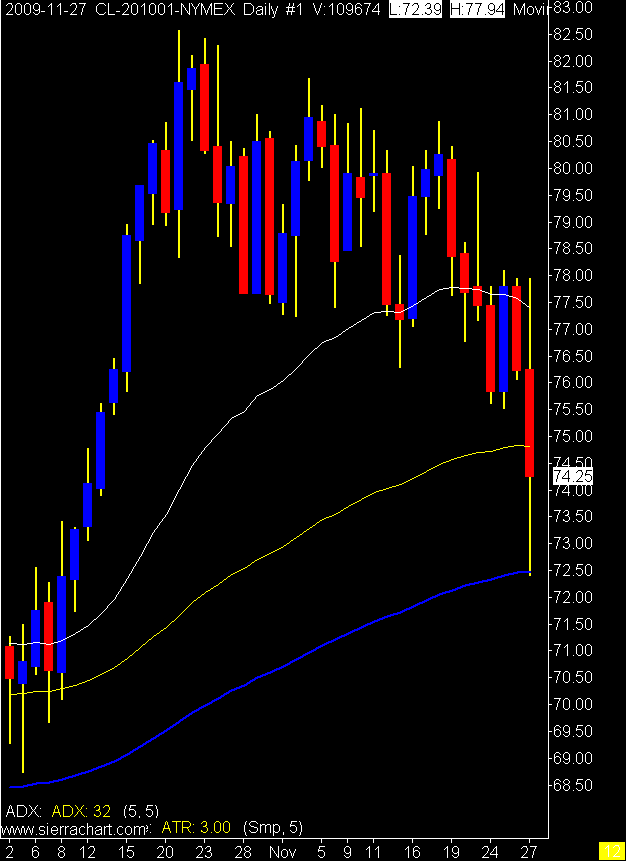
 Nothing like a little 555 tick opening range to get your heart started. Hopefully we see some trade set ups today.
Showing posts with label daily crude oil chart. Show all posts
Showing posts with label daily crude oil chart. Show all posts
11/27/2009
Hello!
Daily Crude Oil Chart
Nothing like a little 555 tick opening range to get your heart started. Hopefully we see some trade set ups today.
Nothing like a little 555 tick opening range to get your heart started. Hopefully we see some trade set ups today.

10/19/2009
Had to post this
This is an interesting interview so I thought I would point you to my fellow blogger to have a look.
Oh and since I stopped blogging my trading has gone downhill so maybe I should start again. Actually my trading has been fine it's the market that has changed. I find it odd that the 5 day ATR on crude oil has fallen under 2.00 while the market is making new highs every day.
I wonder if that means the rally is getting a little tired?
We certainly need a pull back or something to get some volatility / daily range back into the market.
Oops this is turning into a post.
(Edit)
Ok then let's make it a post. With a chart and everything.
Daily Crude Oil Chart
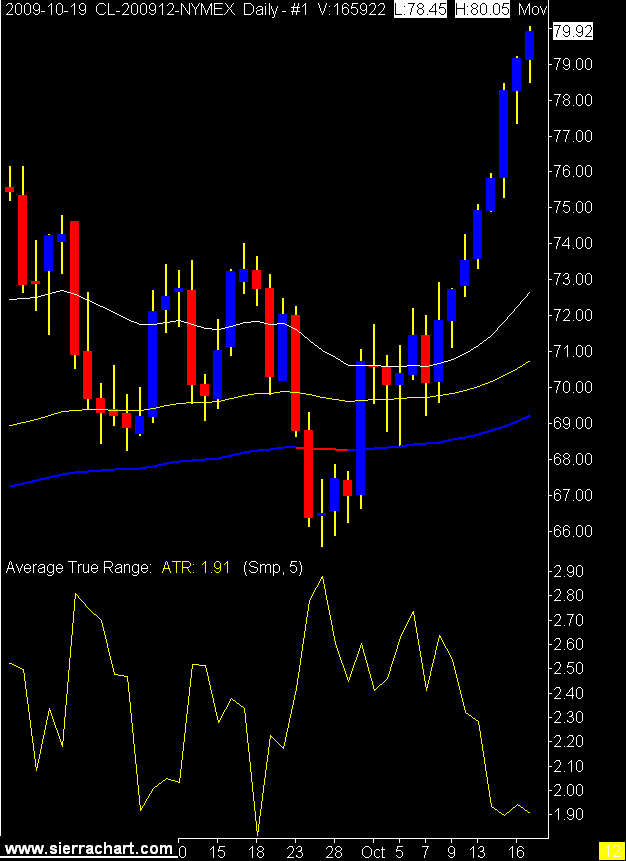
I don't need a price rally, I need a range rally.
Oh and since I stopped blogging my trading has gone downhill so maybe I should start again. Actually my trading has been fine it's the market that has changed. I find it odd that the 5 day ATR on crude oil has fallen under 2.00 while the market is making new highs every day.
I wonder if that means the rally is getting a little tired?
We certainly need a pull back or something to get some volatility / daily range back into the market.
Oops this is turning into a post.
(Edit)
Ok then let's make it a post. With a chart and everything.
Daily Crude Oil Chart
I don't need a price rally, I need a range rally.
8/25/2009
Is it the market or me?
What makes a system perform better some days or weeks than other times? Is it the trader or the market? It can be both but let's assume the trader has his head on straight and is functioning as he should. Maybe I should say she if we are talking about a functional trader. :)
If the trader is on her game then the only other variable is the market. We trade the same system every day but we trade it in market conditions that change every day. The eternal question is, has the market changed so dramatically that my system doesn't work anymore? I think the answer is yes and no. The market may have changed to the point where your system doesn't work as well as it once did, but the market will change again and your system will work again.
What to do?
Risk management rides to the rescue again. Remember we are assuming the trader is following the rules, so the risk management rules should keep you whole until the market returns to "normal".
There is one other thing we can do besides sit on the sidelines. We can trade multiple markets. I am currently trading crude oil, soybeans, and Russell 2000 futures, but I don't trade all of them every day. In June soybeans were the gift that gave every day, in July and August they have been terrible. Crude oil has been moving nicely and the Russell has its moments as well.
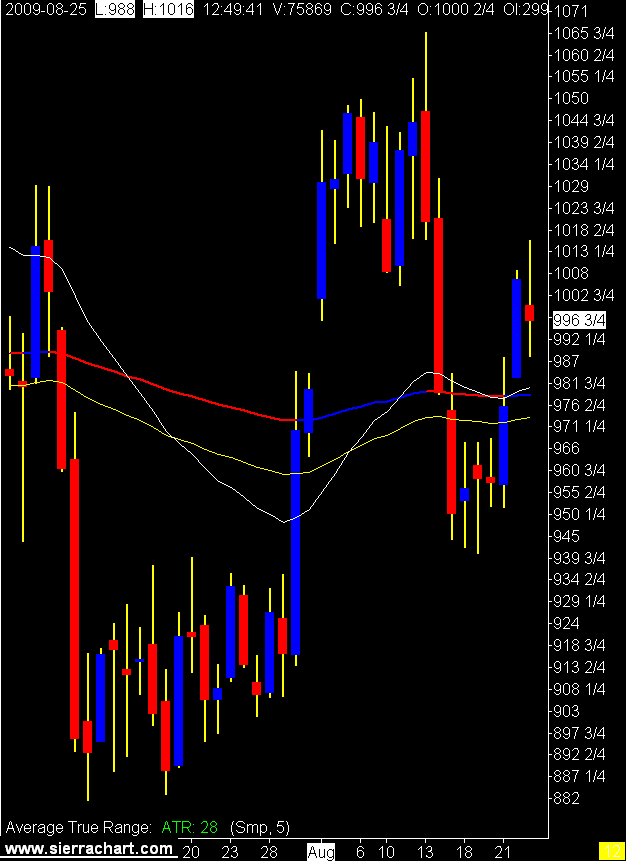
How do you tell if your market is moving? Yes I know you look at it. But is there some math we can apply? For me the ATR (average true range) is a nice guide. Below you see 3 daily charts of the markets I trade. You can see that soybeans keep going flat with crude and the Russell in a nicer trend. You can see that now, looking backwards, as always it's a little harder when it’s actually happening or more precisely when the market conditions are actually changing.
I use a 5 period ATR (5 days average true range) to give me a number. If you track that number, or watch the line, you are given an absolute value of how your market is performing in terms of range.
You need to understand what the ATR number means in ticks for your product. As we are trying to take a little meat out of the middle of the market the larger the sandwich, the easier it is to find that middle. If that makes any sense. :)
So for me, the product with the largest range is the best one to day trade.
Try it and see if it has any value for you.
Daily Russell 2000 Chart
 Daily Soybean Chart
 Daily Crude Oil Chart
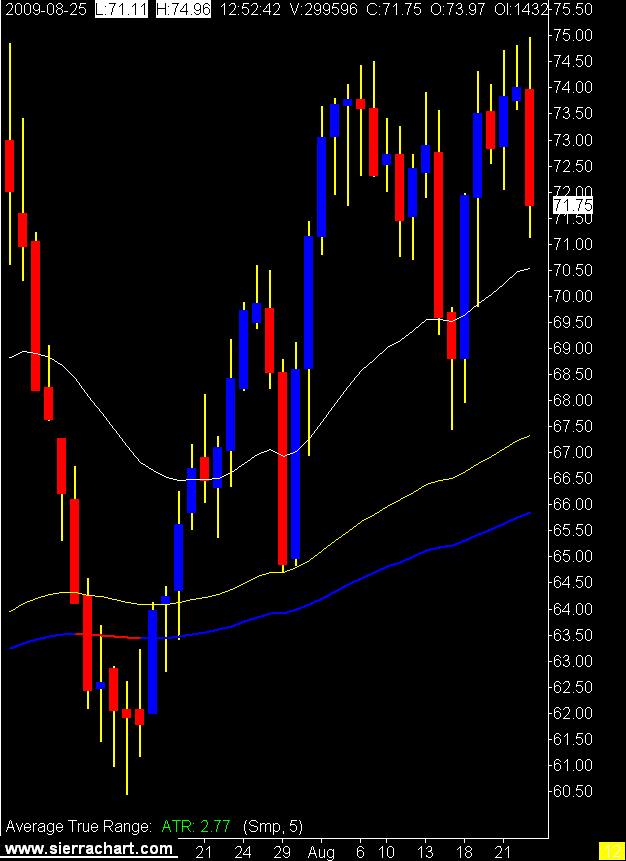 From these charts you see that the Russell's ATR in ticks is 136, soybeans 112, and crude oil at 277.
For my way of thinking and trading, crude is the man.
If the trader is on her game then the only other variable is the market. We trade the same system every day but we trade it in market conditions that change every day. The eternal question is, has the market changed so dramatically that my system doesn't work anymore? I think the answer is yes and no. The market may have changed to the point where your system doesn't work as well as it once did, but the market will change again and your system will work again.
What to do?
Risk management rides to the rescue again. Remember we are assuming the trader is following the rules, so the risk management rules should keep you whole until the market returns to "normal".
There is one other thing we can do besides sit on the sidelines. We can trade multiple markets. I am currently trading crude oil, soybeans, and Russell 2000 futures, but I don't trade all of them every day. In June soybeans were the gift that gave every day, in July and August they have been terrible. Crude oil has been moving nicely and the Russell has its moments as well.
How do you tell if your market is moving? Yes I know you look at it. But is there some math we can apply? For me the ATR (average true range) is a nice guide. Below you see 3 daily charts of the markets I trade. You can see that soybeans keep going flat with crude and the Russell in a nicer trend. You can see that now, looking backwards, as always it's a little harder when it’s actually happening or more precisely when the market conditions are actually changing.
I use a 5 period ATR (5 days average true range) to give me a number. If you track that number, or watch the line, you are given an absolute value of how your market is performing in terms of range.
You need to understand what the ATR number means in ticks for your product. As we are trying to take a little meat out of the middle of the market the larger the sandwich, the easier it is to find that middle. If that makes any sense. :)
So for me, the product with the largest range is the best one to day trade.
Try it and see if it has any value for you.
Daily Russell 2000 Chart
Daily Soybean ChartDaily Crude Oil Chart From these charts you see that the Russell's ATR in ticks is 136, soybeans 112, and crude oil at 277. For my way of thinking and trading, crude is the man.
8/03/2009
The World Was Flat
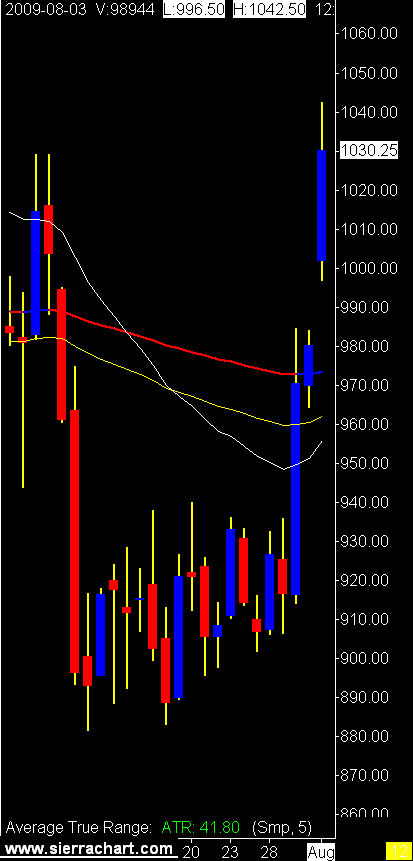
I was complaining that soybeans had not offered much to trade in July. Looking at the daily chart for July you can see why. When the world is flat stay on the beach.
Daily Soybean Chart
 Crude on the other hand has been anything but flat and the opportunities to trade intraday have been plentiful.
Daily Crude Oil Chart
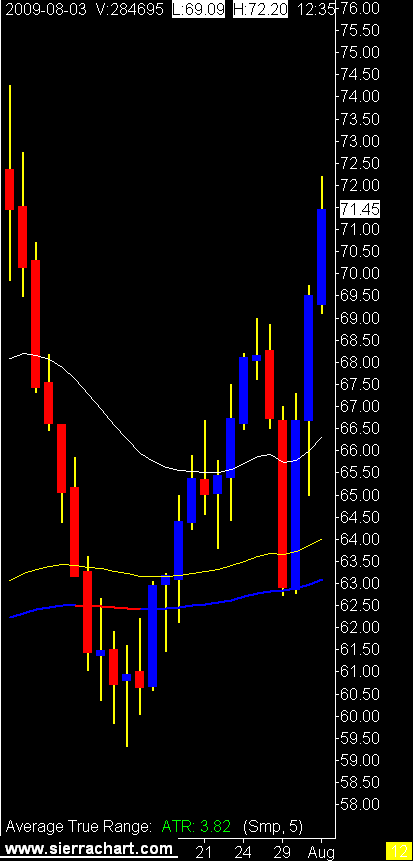 The message is, listen carefully now the guru is speaking, trade the bumpy chart not the flat one.
Daily Soybean Chart
Crude on the other hand has been anything but flat and the opportunities to trade intraday have been plentiful.Daily Crude Oil Chart
The message is, listen carefully now the guru is speaking, trade the bumpy chart not the flat one.
3/02/2009
We're all Going to Die
In times like this it's important not to panic. To remain calm, a Captain Chesley Sullenberger kind of calm.
A simple "brace for impact" kind of calm.
With that in mind I offer the following kind, humorous, warm, and fuzzy little video.
Which is differnt from the original video I had chosen today. This one did not play well in the "room".
Daily DOW Futures Chart

Daily Crude Oil Chart
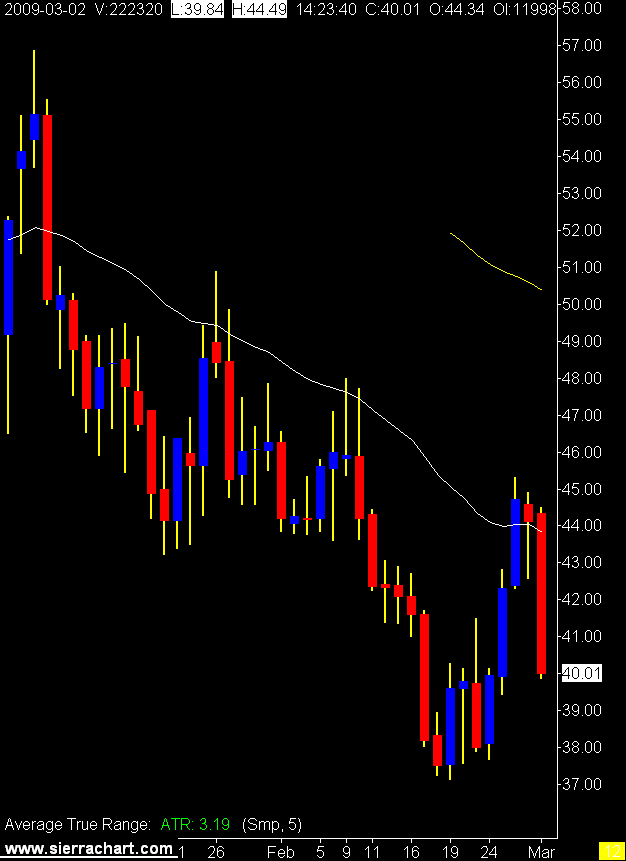
So with the DOW collapsing again I am looking to deploy some retirement cash. The last time I did this was Oct 2008.
Then we had Nov 2008. Ouch.
I held through and sold a few weeks ago for a small profit.
This time I'm looking at Canadian Real Estate Investment Trust and Cominar for an income producing long term hold.
We shall see.
A simple "brace for impact" kind of calm.
With that in mind I offer the following kind, humorous, warm, and fuzzy little video.
Which is differnt from the original video I had chosen today. This one did not play well in the "room".
Daily DOW Futures Chart
Daily Crude Oil Chart
So with the DOW collapsing again I am looking to deploy some retirement cash. The last time I did this was Oct 2008.
Then we had Nov 2008. Ouch.
I held through and sold a few weeks ago for a small profit.
This time I'm looking at Canadian Real Estate Investment Trust and Cominar for an income producing long term hold.
We shall see.
10/09/2008
Sad Looking Charts
Daily DOW Futures Chart

Daily Crude Oil Futures Chart
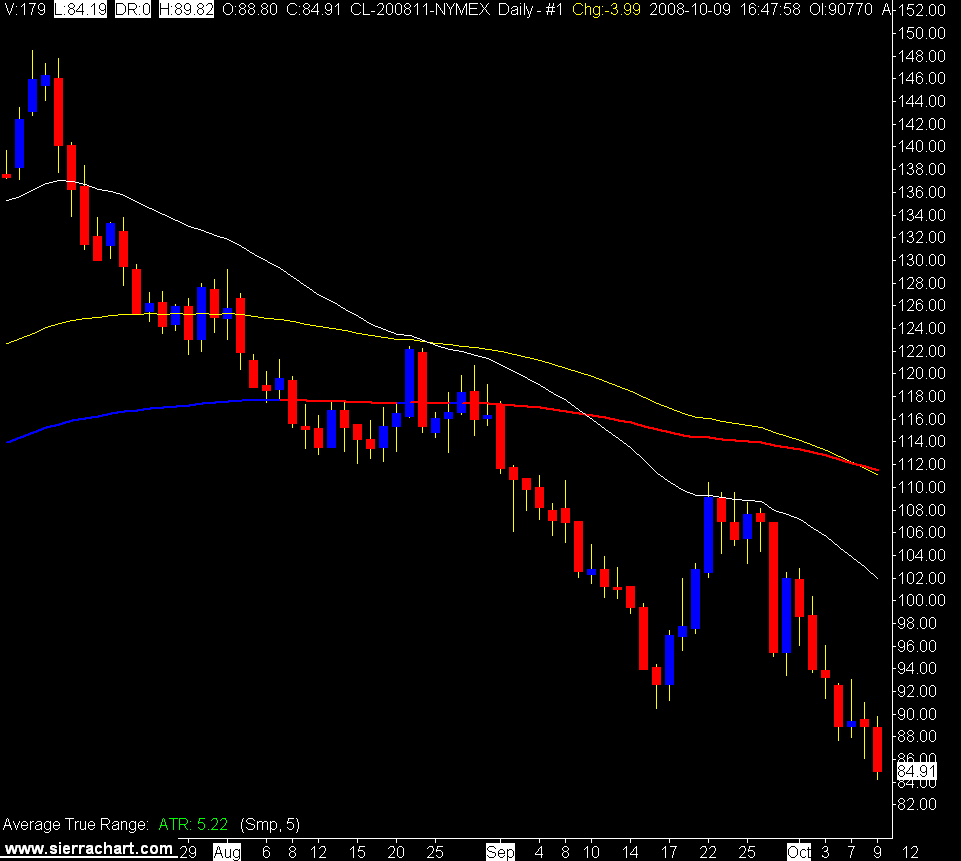
What can I say, the pictures tell it all.
If you hold investments in retirement accounts, check the level of debt in the companies you own. If they are not highly leveraged close your eyes and hang on.
Don't be scared into selling, look at the fundamentals of the companies you own. You were supposed to do that before you bought them, better late than never I guess.
Hedge funds are selling stock because of margin calls, mutual funds are selling stock because of unit holder redemption's.
Stupid money is selling.
Smart money is buying.
Warren Buffett is buying.
Daily Crude Oil Futures Chart
What can I say, the pictures tell it all.
If you hold investments in retirement accounts, check the level of debt in the companies you own. If they are not highly leveraged close your eyes and hang on.
Don't be scared into selling, look at the fundamentals of the companies you own. You were supposed to do that before you bought them, better late than never I guess.
Hedge funds are selling stock because of margin calls, mutual funds are selling stock because of unit holder redemption's.
Stupid money is selling.
Smart money is buying.
Warren Buffett is buying.
9/02/2008
Crude Oil Breaks $110
This looks interesting.
Hopefully the best trading is not done for the day.
Daily Crude Oil Chart

Hopefully the best trading is not done for the day.
Daily Crude Oil Chart
8/06/2008
How Low Will Crude Oil Go?
Crude oil seemed to find some support around the 89EMA as it stuck to it for 9 days. However it has now broken free of the 89EMA and is sitting on the 144EMA. If it breaks this level $100.00 can't be too far away.
Of course I don't make long term price predictions.
Mainly because I'm always wrong.
Daily Crude Oil Chart (click on chart to view)

Of course I don't make long term price predictions.
Mainly because I'm always wrong.
Daily Crude Oil Chart (click on chart to view)
5/15/2008
Another Crude Oil Prediction?
I believe I may have fearlessly predicted the top in crude oil on April 24, 2008, with oil trading well under $120.00.
So with that enviable track record on crude oil price predictions I shall not venture there again.
I will however, mention the daily candle formation today known as a doji. This particular candle formation is supposed to mean a change in direction is possible.
But I will make no such prediction.
The downward moves today were wild and fast, but by the end of the day price had crawled back up to finish basically flat on the day.
I'm glad I don't have to make that direction call, as every day, day after day, I just trade what I see.
Daily Crude Oil Chart (click on chart to view)

15 Minute Crude oil Chart

Since corn is now considered a fuel I thought I would take a look at the July corn daily chart. We also see a doji candle on May 9th and then see price moving down and through the 34 EMA.
All interesting items to note, but to place a long term trade to the short side in either crude oil or corn would take some courage at this time.
Eventually what goes up comes down.
The question remains when.
Daily Corn Chart

So with that enviable track record on crude oil price predictions I shall not venture there again.
I will however, mention the daily candle formation today known as a doji. This particular candle formation is supposed to mean a change in direction is possible.
But I will make no such prediction.
The downward moves today were wild and fast, but by the end of the day price had crawled back up to finish basically flat on the day.
I'm glad I don't have to make that direction call, as every day, day after day, I just trade what I see.
Daily Crude Oil Chart (click on chart to view)
15 Minute Crude oil Chart
Since corn is now considered a fuel I thought I would take a look at the July corn daily chart. We also see a doji candle on May 9th and then see price moving down and through the 34 EMA.
All interesting items to note, but to place a long term trade to the short side in either crude oil or corn would take some courage at this time.
Eventually what goes up comes down.
The question remains when.
Daily Corn Chart
Subscribe to:
Posts (Atom)