If the trader is on her game then the only other variable is the market. We trade the same system every day but we trade it in market conditions that change every day. The eternal question is, has the market changed so dramatically that my system doesn't work anymore? I think the answer is yes and no. The market may have changed to the point where your system doesn't work as well as it once did, but the market will change again and your system will work again.
What to do?
Risk management rides to the rescue again. Remember we are assuming the trader is following the rules, so the risk management rules should keep you whole until the market returns to "normal".
There is one other thing we can do besides sit on the sidelines. We can trade multiple markets. I am currently trading crude oil, soybeans, and Russell 2000 futures, but I don't trade all of them every day. In June soybeans were the gift that gave every day, in July and August they have been terrible. Crude oil has been moving nicely and the Russell has its moments as well.
How do you tell if your market is moving? Yes I know you look at it. But is there some math we can apply? For me the ATR (average true range) is a nice guide. Below you see 3 daily charts of the markets I trade. You can see that soybeans keep going flat with crude and the Russell in a nicer trend. You can see that now, looking backwards, as always it's a little harder when it’s actually happening or more precisely when the market conditions are actually changing.
I use a 5 period ATR (5 days average true range) to give me a number. If you track that number, or watch the line, you are given an absolute value of how your market is performing in terms of range.
You need to understand what the ATR number means in ticks for your product. As we are trying to take a little meat out of the middle of the market the larger the sandwich, the easier it is to find that middle. If that makes any sense. :)
So for me, the product with the largest range is the best one to day trade.
Try it and see if it has any value for you.
Daily Russell 2000 Chart
 Daily Soybean Chart
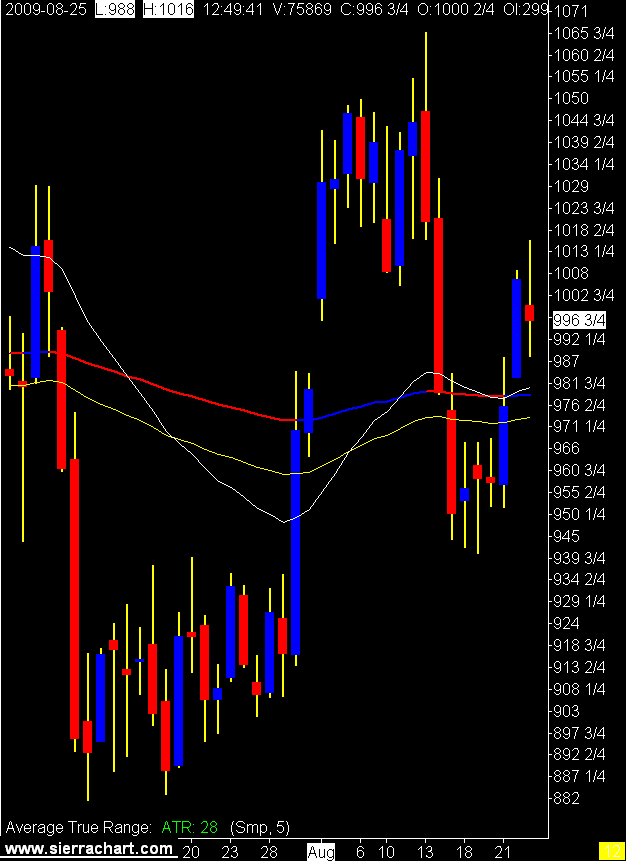 Daily Crude Oil Chart
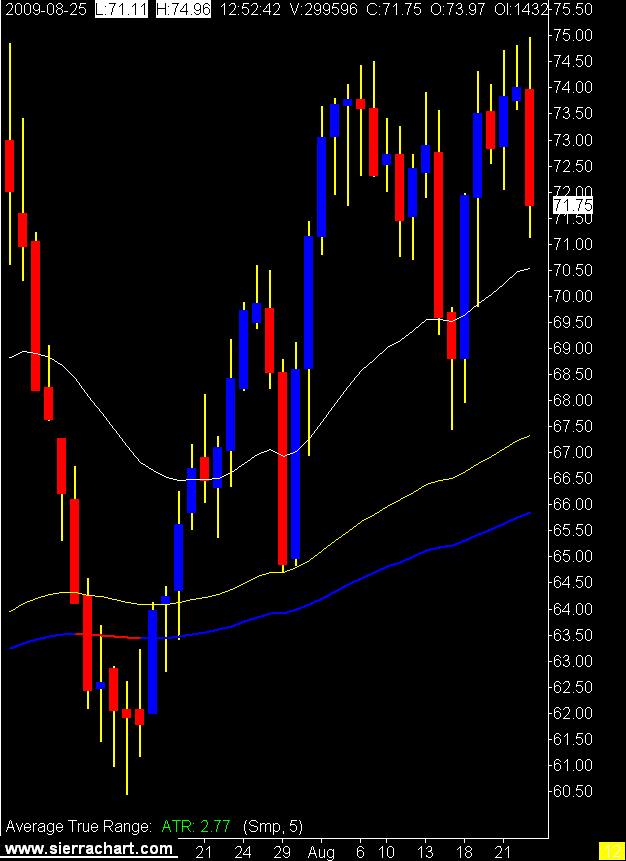 From these charts you see that the Russell's ATR in ticks is 136, soybeans 112, and crude oil at 277.
 For my way of thinking and trading, crude is the man.
2 comments:
SWAMI!!!
Why hasn't UF said anything I wonder...
LOL!
He's very busy with his 12 cent poker games.
Or
He thinks all Swamis (solfest channels 13 yr old daughter) are like so overrated.
Post a Comment