Showing posts with label ATR. Show all posts

10/19/2009

Had to post this

This is an interesting interview so I thought I would point you to my fellow blogger to have a look.

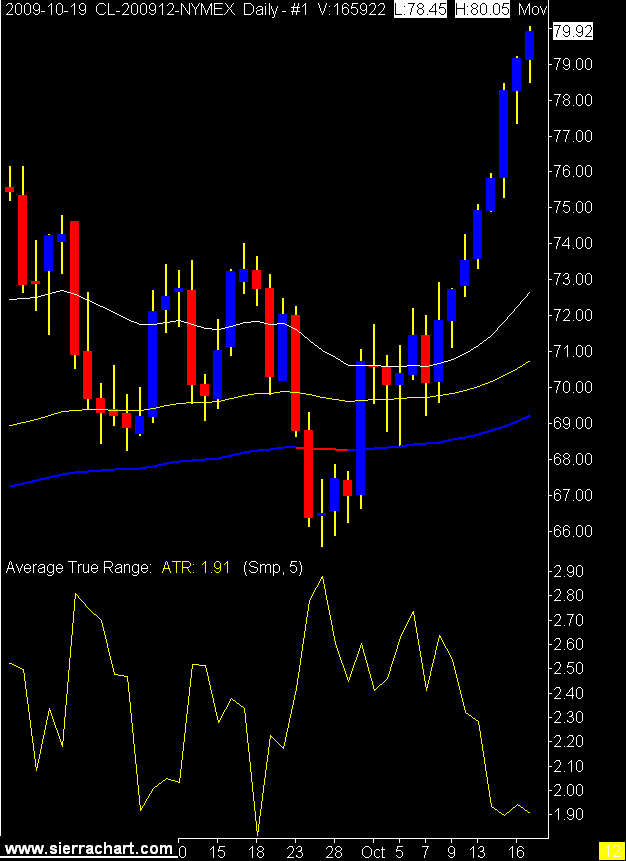
Oh and since I stopped blogging my trading has gone downhill so maybe I should start again. Actually my trading has been fine it's the market that has changed. I find it odd that the 5 day ATR on crude oil has fallen under 2.00 while the market is making new highs every day.

I wonder if that means the rally is getting a little tired?

We certainly need a pull back or something to get some volatility / daily range back into the market.

Oops this is turning into a post.
(Edit)

Ok then let's make it a post. With a chart and everything.

Daily Crude Oil Chart

I don't need a price rally, I need a range rally.

8/27/2009

The Swami Speaketh

I find you odd.

Yes, you.

You never know what kind of post topic is going to push trader's buttons, so to speak. Jules said I was sounding swami like with my previous post. The EIT (exceptional Irish trader) had told me the same thing after he read that post. Ok he actually called me guru like.

I found this all rather offensive as I thought I had just posted a blog stating that I don't want to be your guru.

Maybe I do?

No

I don't.

I thought my point about what market do you trade was important. I still do. I think it's very important. In fact I think it is the most important factor after money management. So I offered what I thought was a very simple way to gauge different markets in order to see if there might be something else out there that you could trade. There may be something better than crude oil, if so let me know. Crude isn't always the best thing to trade as there are many posts on this blog with me whining about the lack of signals on crude oil.

Anyway I thought it was important but I get the feeling that you don't. Maybe I didn't say it right, or maybe I sounded too swami like. If so I apologize.

What if all our plans, technical analysis, indicators, systems, didn't matter? What if the only thing that mattered was a market that will get in a trend and stay there for a while? If that were the case, or at least partially the case then maybe we should take a little time and examine the different products there are to trade. Maybe we should spend more time on that rather than hours of studying whether a 34 EMA is better than a 21 EMA?

You can look at daily or hourly charts with the ATR as a guide to quantify the products range. It doesn't really matter how you measure as long as you apply the same measurement to all the markets you want to look at.

That leads me to another point, the market you want to look at. People seem hesitant to look at something else, they get very attached to their market and they don't want to leave it. I know I am the same way, slow to change.

You don't have to change, just look. Measure a few different markets and if something jumps out at you sim trade it for a while. Yes the power of sim, you don't have to dive into the crude oil pit head first (oops I let that crude bias slip out there) you can sim trade.

Why not?

Since I'm wagging crude's tail today have a look at the chart. I know, I know, you're saying, will he just shut up and post some charts!

Fine, be that way and since I am not your Swamiguru you can just look at the shiny chart and forget everything I said. :)

2 Minute Crude Oil Chart
I took the first two and passed on the last two.

8/25/2009

Is it the market or me?

What makes a system perform better some days or weeks than other times? Is it the trader or the market? It can be both but let's assume the trader has his head on straight and is functioning as he should. Maybe I should say she if we are talking about a functional trader. :)

If the trader is on her game then the only other variable is the market. We trade the same system every day but we trade it in market conditions that change every day. The eternal question is, has the market changed so dramatically that my system doesn't work anymore? I think the answer is yes and no. The market may have changed to the point where your system doesn't work as well as it once did, but the market will change again and your system will work again.

What to do?

Risk management rides to the rescue again. Remember we are assuming the trader is following the rules, so the risk management rules should keep you whole until the market returns to "normal".

There is one other thing we can do besides sit on the sidelines. We can trade multiple markets. I am currently trading crude oil, soybeans, and Russell 2000 futures, but I don't trade all of them every day. In June soybeans were the gift that gave every day, in July and August they have been terrible. Crude oil has been moving nicely and the Russell has its moments as well.

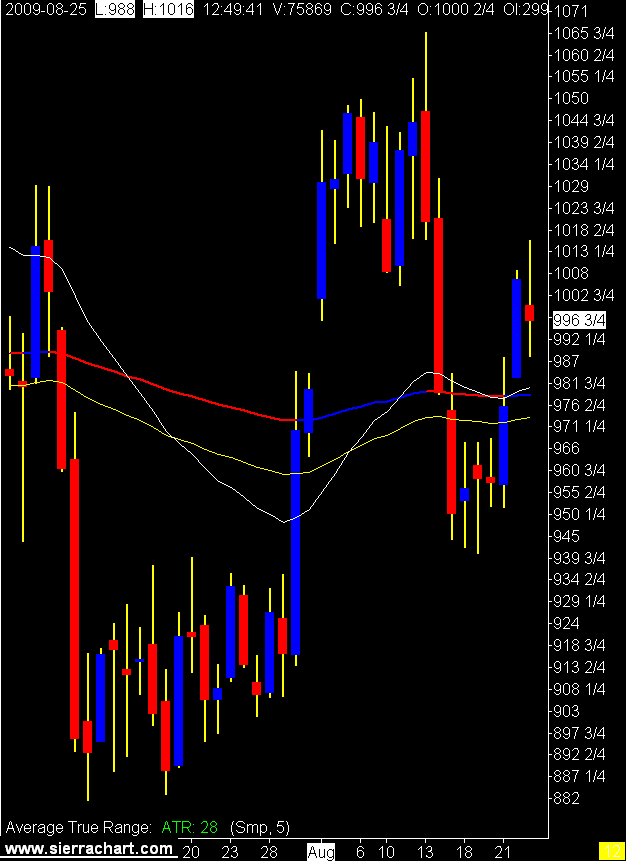
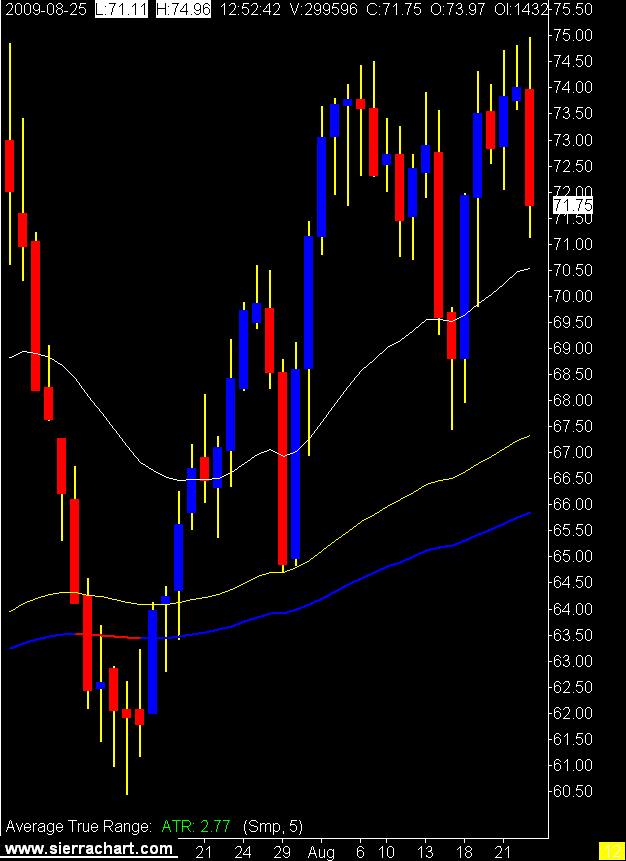
How do you tell if your market is moving? Yes I know you look at it. But is there some math we can apply? For me the ATR (average true range) is a nice guide. Below you see 3 daily charts of the markets I trade. You can see that soybeans keep going flat with crude and the Russell in a nicer trend. You can see that now, looking backwards, as always it's a little harder when it’s actually happening or more precisely when the market conditions are actually changing.

I use a 5 period ATR (5 days average true range) to give me a number. If you track that number, or watch the line, you are given an absolute value of how your market is performing in terms of range.

You need to understand what the ATR number means in ticks for your product. As we are trying to take a little meat out of the middle of the market the larger the sandwich, the easier it is to find that middle. If that makes any sense. :)
So for me, the product with the largest range is the best one to day trade.

Try it and see if it has any value for you.

Daily Russell 2000 Chart
Daily Soybean ChartDaily Crude Oil Chart From these charts you see that the Russell's ATR in ticks is 136, soybeans 112, and crude oil at 277.

For my way of thinking and trading, crude is the man.

8/03/2009

Renko Bars and Range Bars

WARNING: This post is very long and has no pictures. If this alarms you skip down to the next post which has few words and shiny pictures of charts.

Pandu the FX trader from Australia asked me this on an old post.

"I want to know what do you mean by 'The hard stop value is set as a % of the range bar we are trading.'. What is the meaning of 'Range Bar'? Also, what parameters do you use for the ADX you use?"

So that along with all the google searches for renko bar trading I get on this blog I thought I should take a moment and discuss why I quit using range bars and or renko bars.

In a word, time.

We all have access to the same data, we all live in the same space and time continuum. I heard that on Star Trek I think.

I don't move the market. I want to be looking at what most everyone else is looking at. Why? Because I'm going to ride along with whomever, collectively or all by themselves, does move the market.

So we're all looking at price move and we are all breaking down that price action with different methods. We have volume, time, and tick data and all of it tracks the same price but presents the trader bar closes in different ways. I want to look at the chart picture with the method, time, that I think most other traders are using. Note I said think, not know.

Of course everyone who uses one of those categories thinks it is the best. Until they change, just like I have. :)

Back to Pandu's question. The range bar measures a set range of price movements and when that range is met the bar prints.

A renko bar does the same except the range has to be all in one direction for the bar to print. So with a 10 tick renko bar the range has to be all up or all down for it to print. A 10 tick range bar could open at 70.25 and have 5 ticks up to 70.30 and 5 ticks down to 70.20 and the bar would print. A 10 tick renko bar would have to have 10 ticks up to 70.35 or 10 ticks down to 70.15 before it would print.
There are other little nuances to them both depending on your chart service but I'm not going into that here.

Got it? I hope so it exhausted me explaining it.

So the benefits to both are when price moves quickly the bars start printing. We need the bars to print in order for our indicators to, well, indicate. It may be a shock for some but all our indicators are lagging. Sorry. They need the price bars to move in order for them to do their "magic".

This all sounds good and works for many people, like the man who loves rain (Rainwater) and really wants to be included in Jules private blog but is too shy to ask. (Rainwater uses range bars not renko bars)

Actually it sounds so good it's making me wonder why I gave them up?

Renko, I gave up because there can be too much intra bar movement and it is too hard to find your way in with renko alone. I started using time charts with renko and then eventually just dumped the renko. Renko charts are great for keeping you in a trade and could be used for a technical exit, but then I started trading for a target rather than a technical exit so renko went bye bye.

Range bars are probably of more use but I found they gave me too many false starts and I need to control my pushy the button fingers.

I control them with time.

Time, I have to wait. I use 1 and 2 minute bars so I don't wait for long but for me, let me say again, for me, I find that time works the best.

Am I late sometimes? Yes. I give that up in order to stay out of some false moves.

So there it is, my trading still looks at range via the ATR, I need to see some movement in one direction via the ADX, I need price on the right side of the EMA's, I look for a higher high or lower low and away we go.

The longer multiple EMAs are there to simulate what a longer term chart would be showing in terms of trend and direction. Like a 5 and 15 minute chart or so.

This is a very long post with no pictures which may be alarming to some. I better place a warning at the top of this post.

Oh yes the rest of Pandu's questions. My stop on the range or renko bar was a % of the bar I was using. So for a 20 tick range bar I may use 75% of that as a stop, 15 ticks. With the ADX and ATR I am looking for a minimum threshold to be met before I start looking for signals. That's all.

P.S. Those renko bar charts were sure pretty.

Home
7/28/2009

Change

I did peek a little at charts while on holidays, which was a mistake, and found myself squinting at little charts on my laptop. This got me to thinking about getting the CL trading down to one chart instead of two.

I only use the one minute chart for soybeans but have found with crude oil I need to see trend and range on both the three and one minute charts in order to stay out of trouble. Besides having to watch two charts I have also found that when I see blue on one of the charts I want to hit the button rather than waiting for conformation from the second chart.

So being the quantitative genius that I am I added one minute to three minutes, divided by two and came up with a 2 minute chart.

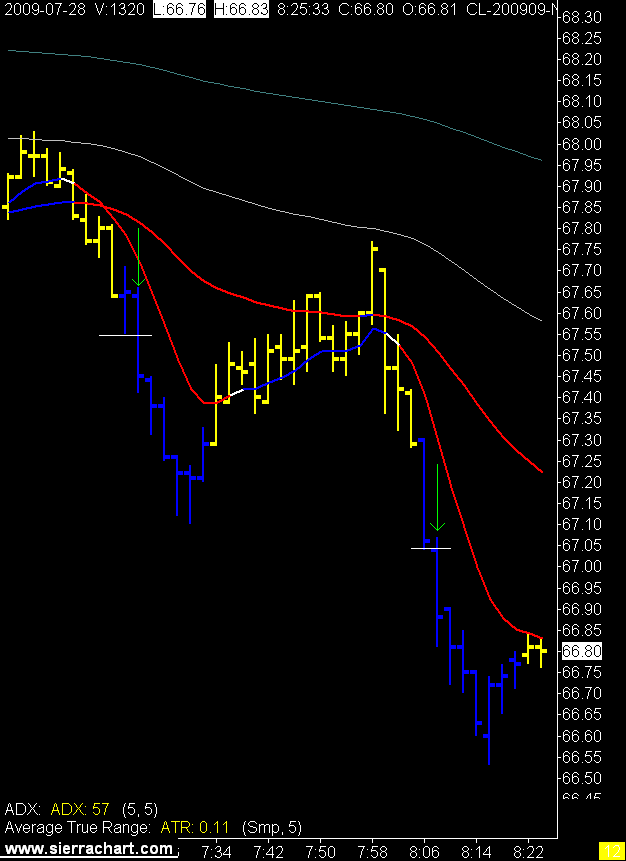
Still playing with the ADX and ATR settings but found a couple of nice trades today. The trend was so strong this morning blind monkeys could have made money today. Only time will tell if the settings will keep me out of the flats and in the trends.

2 Minute Crude Oil Chart

11/14/2008

A Tale of Two Trends

A wise old trader tells all who will listen the key to success in trading is knowing when not to trade. That would suggest another key is knowing when to trade. For me when to trade is when there is a trend with some range. All other time in the market should have you flat.

Today there was not alot of time where you needed to be flat. The day only got better as it went along with 2 huge moves in the afternoon session. The down move was faster than the up move. You can see them nicely on the three minute chart.

How you get in and out of these trends really doesn't matter, the key is to identify when a trend is in place and trade it. Just as the key is to identify when there is no trend in place and stay flat.

Identifying trend is easier said than done as many moves start out looking good only to reverse quickly. I have not mastered this yet but do find multiple time frames and the average true range a good way to identify a trend to trade.

9/30/2008

Now We Wait

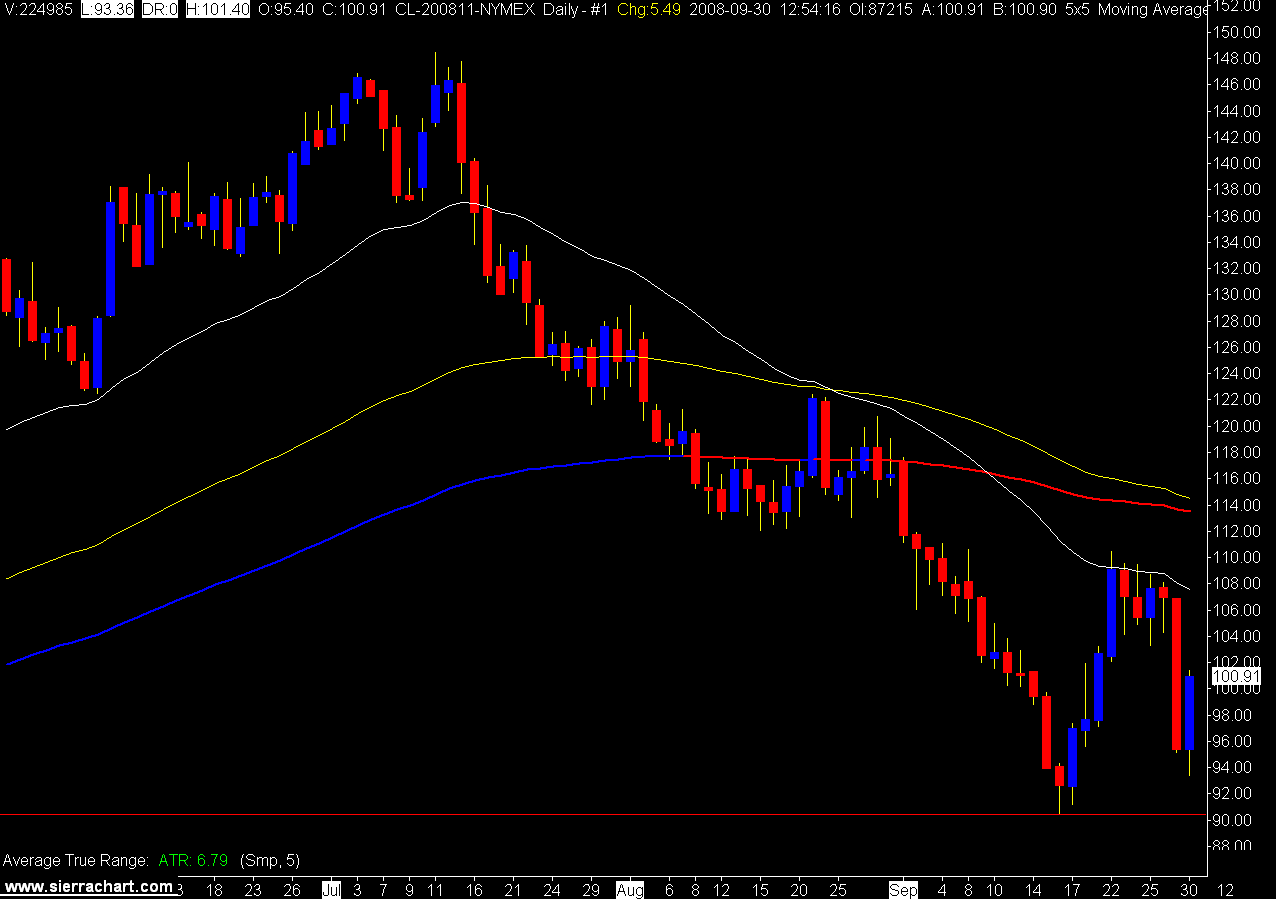
Daily Crude Oil Chart (click on chart to view)

The daily still looks like it is going to head south again, but I don't swing trade so I don't care.

After we find out if Congress is going to do anything, we still have an American consumer with too much debt and American banks that are not going to be quite as willing to lend money.

Of course once the sub prime mortgage crisis settles down we can start on the credit card crisis.

All in all unless China and India can make up for the reduction in American crude oil demand I think oil is headed lower.

You would think that on a day like yesterday that saw crude oil move $10.00 +, a nice Norwegian, Danish, Swedish, English, Canadian could make some money trading it.

You would think that, but you would be wrong. Yesterday's stats, 1 win, 1 be, 3 losers, for 35 winning ticks / 42 losing ticks = RR .83.

Today's much milder trade had 3 wins, 2 bes, 3 losers, for 108 winning ticks / 38 losing ticks = RR 2.84.

There are times when the trade simply becomes too volatile to trade with your "normal" time frame. The best chart to trade yesterday would have been the 15 minute chart. At least I recognized that my time frame was not working and quit trading early.

Today's more "normal" price action fits my trade template. One indicator you can use to recognize this is the Average True Range. I keep a 3 minute chart up with a 10 period ATR on for this purpose. You can also see it in the DOM, if price action is jumping all over the place you are either going to have to change your trade parameters or stay out of the market.

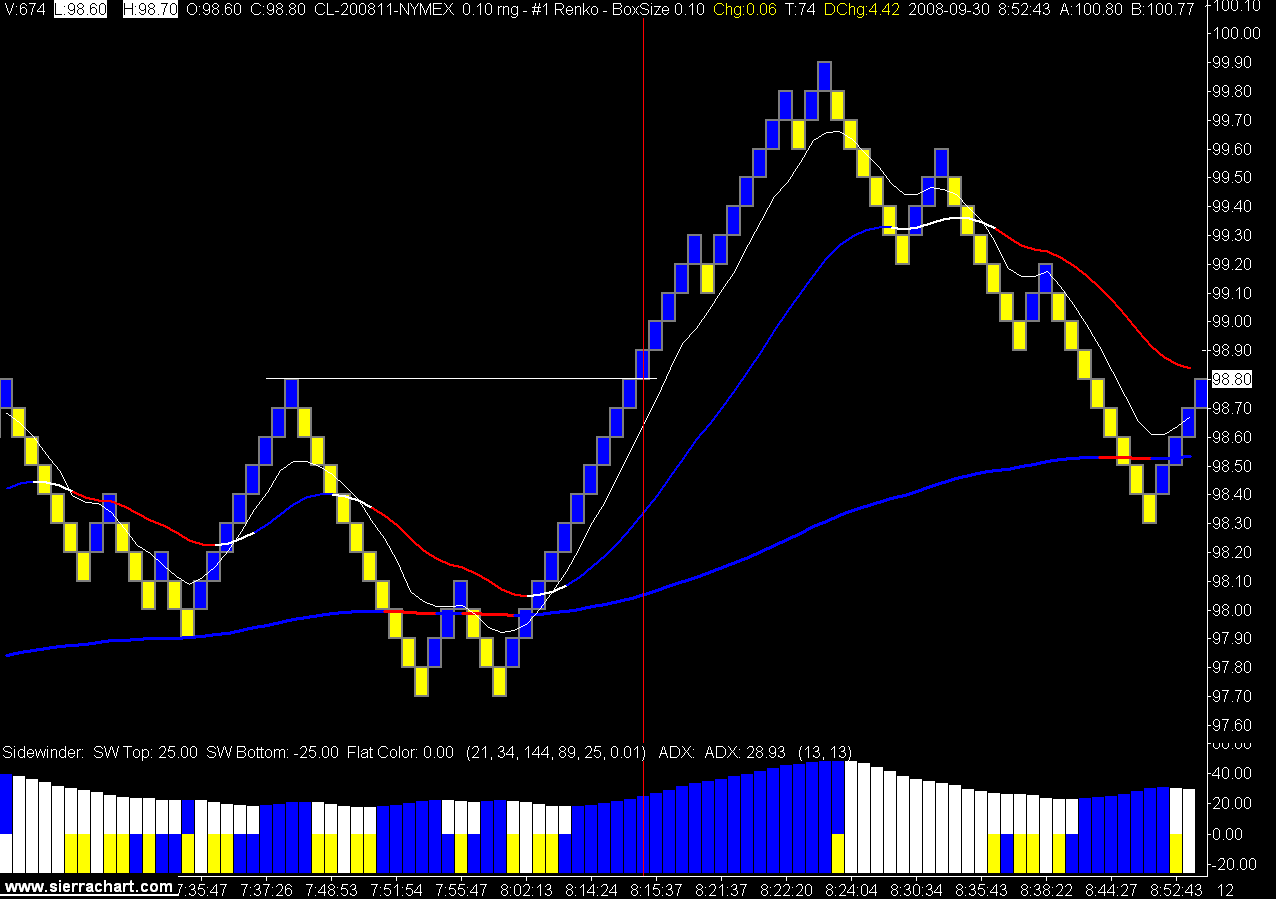
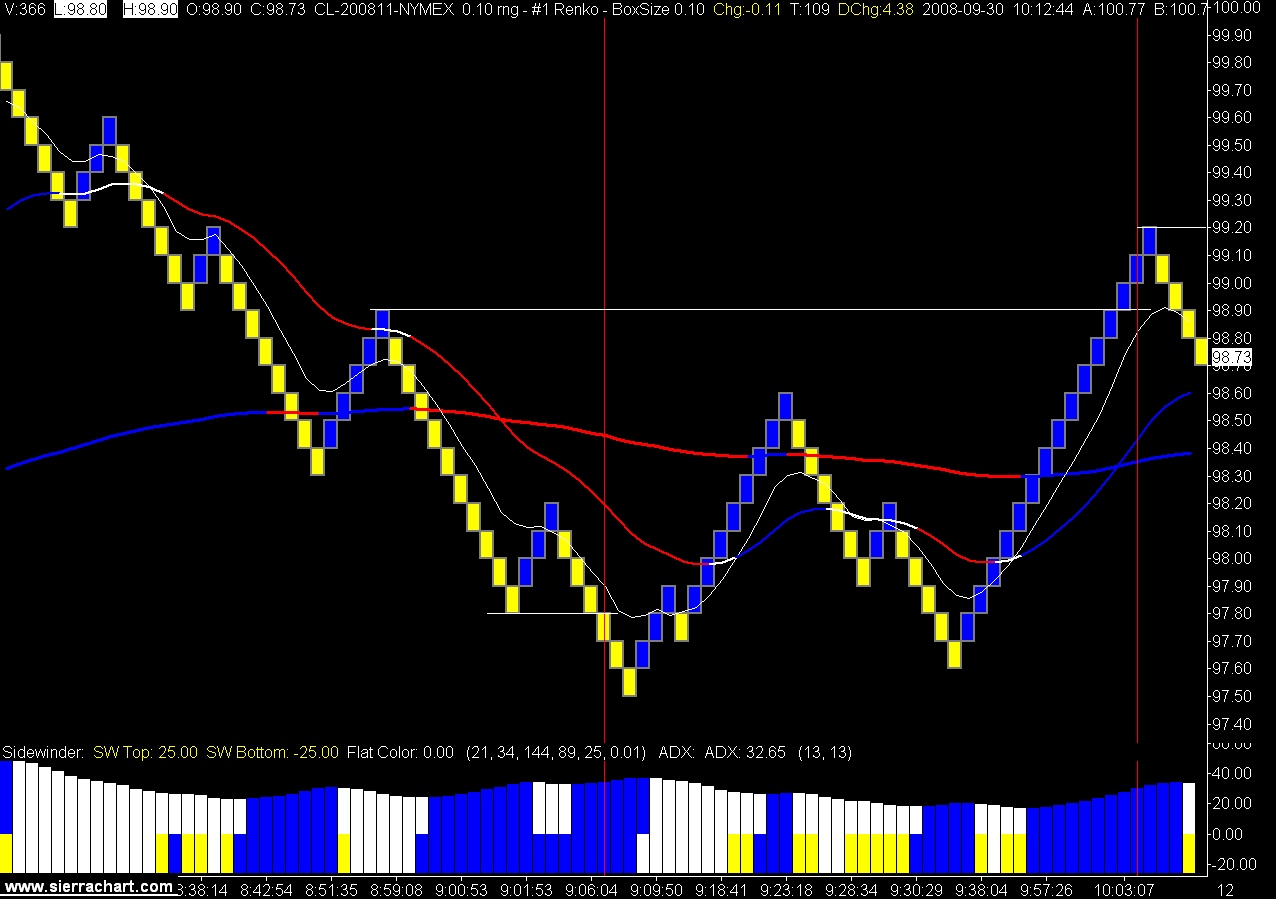
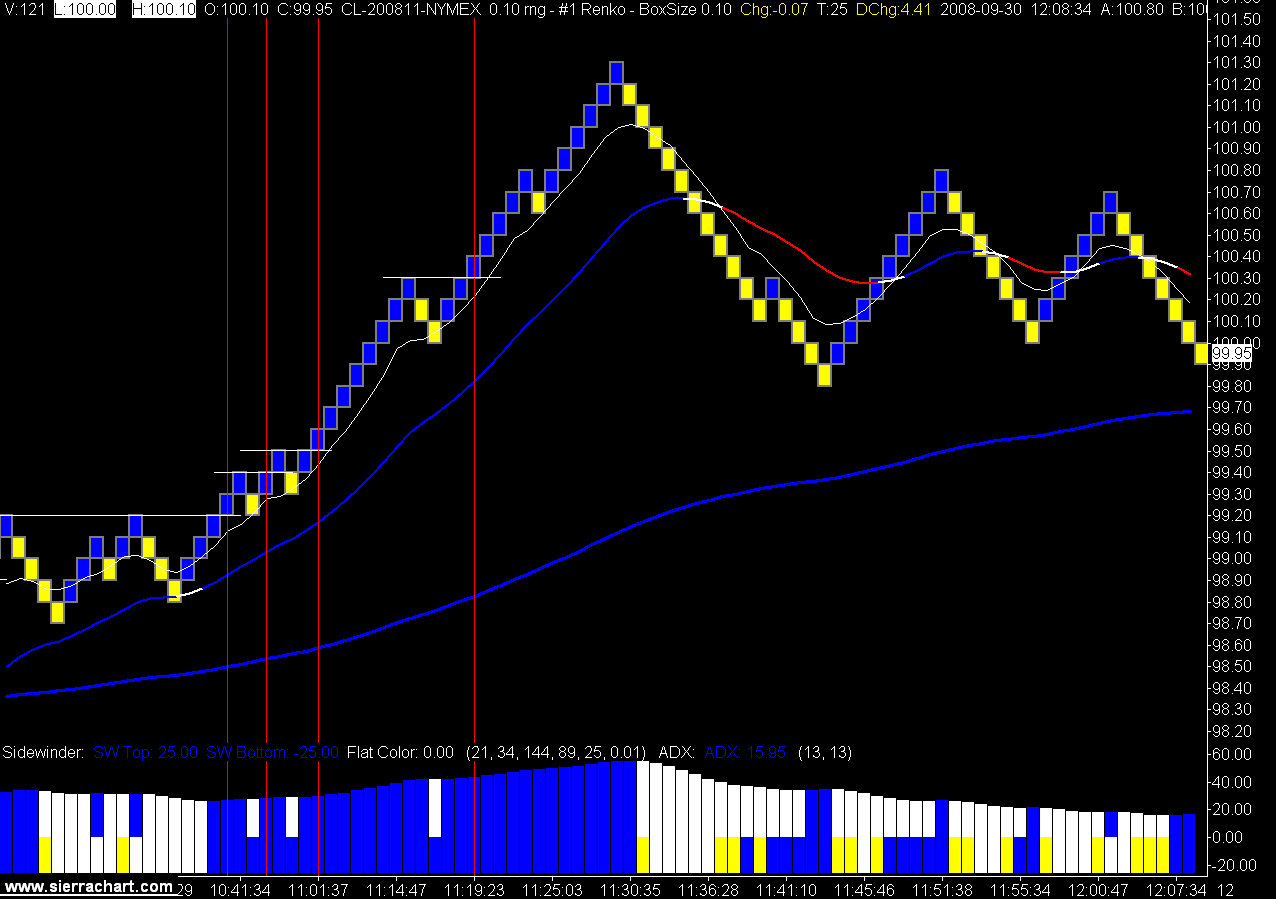
Today's trades