Showing posts with label renko charts. Show all posts

9/25/2008

Crude Oil Trades

Daily Crude Oil Chart (click on chart to view)


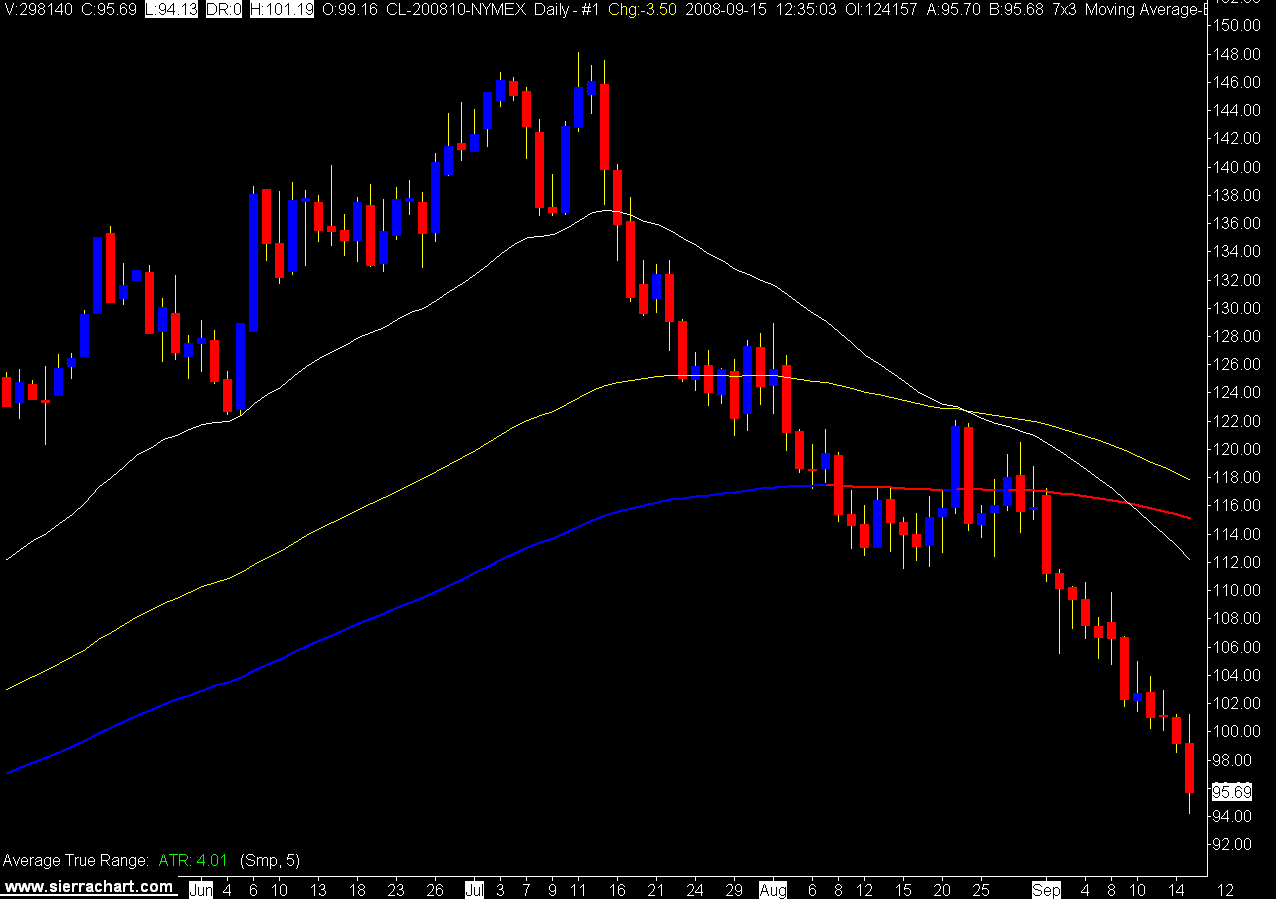
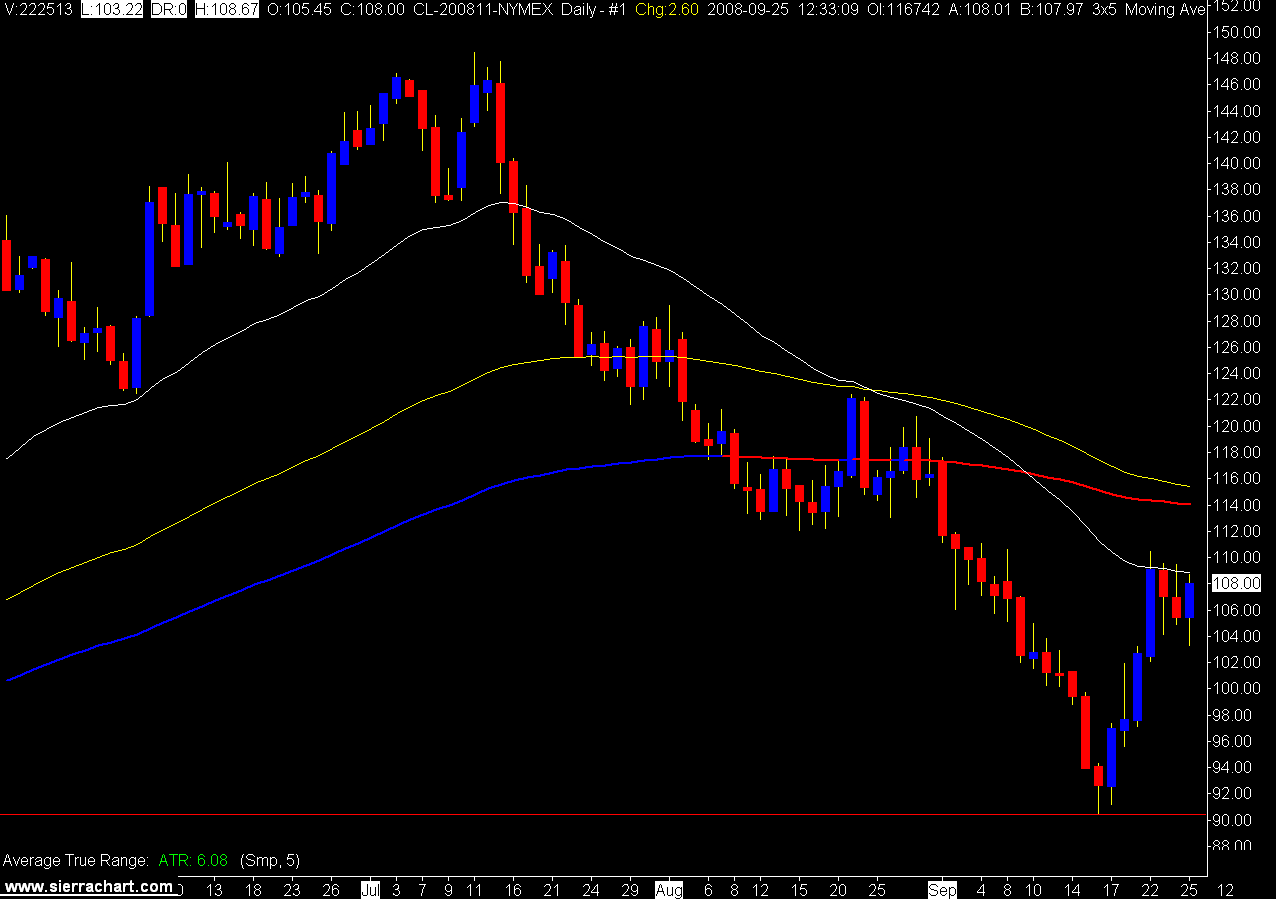
The daily chart has run into the 34 EMA (white line) and looks like it could revert back to the downside. Either that or its waiting for the U.S bailout package to be finalized and all will be well in the neighborhood.

I think demand for oil will continue to drop, and when the gulf production gets back to 100% oil could be headed south.

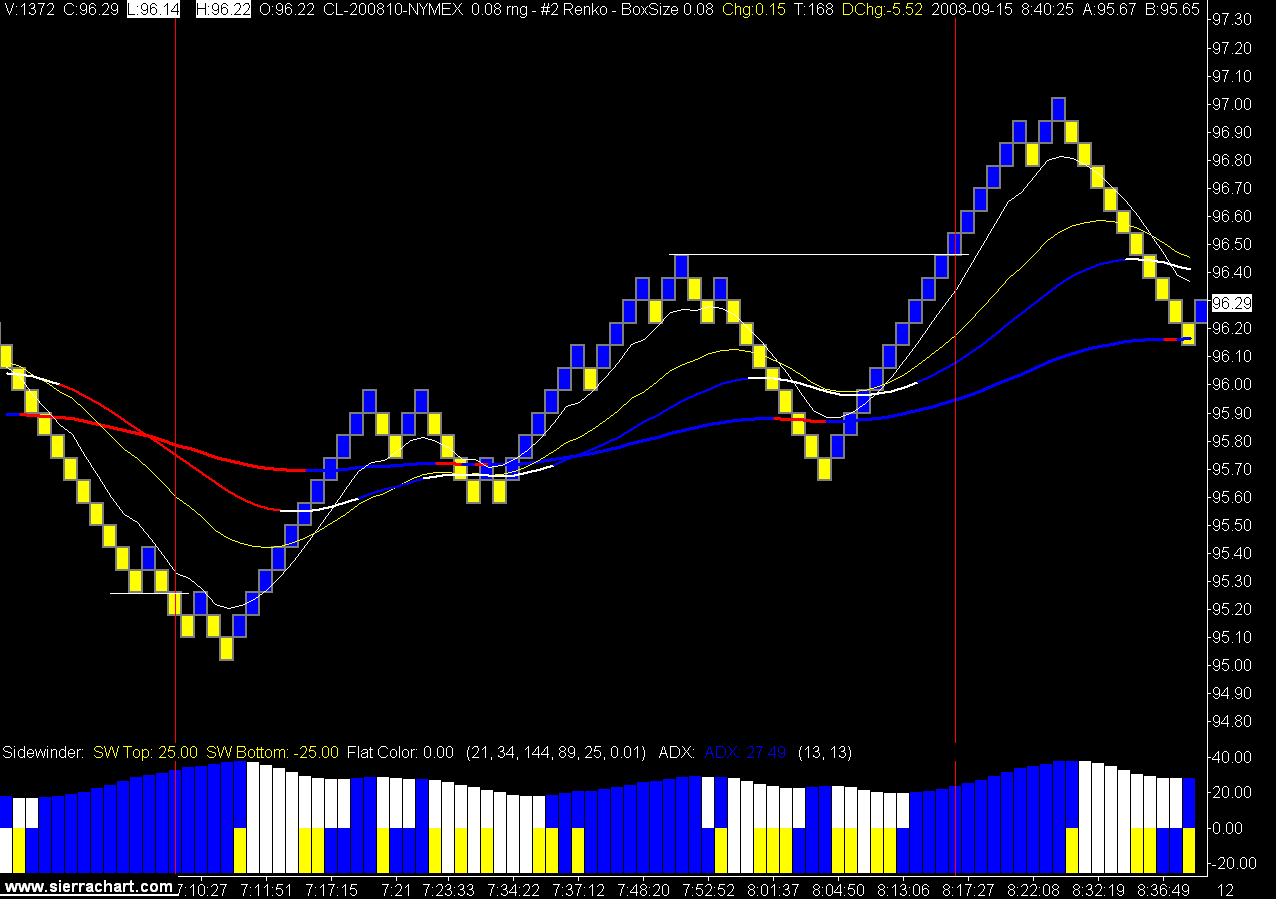
13 Tick Crude Oil Renko Chart


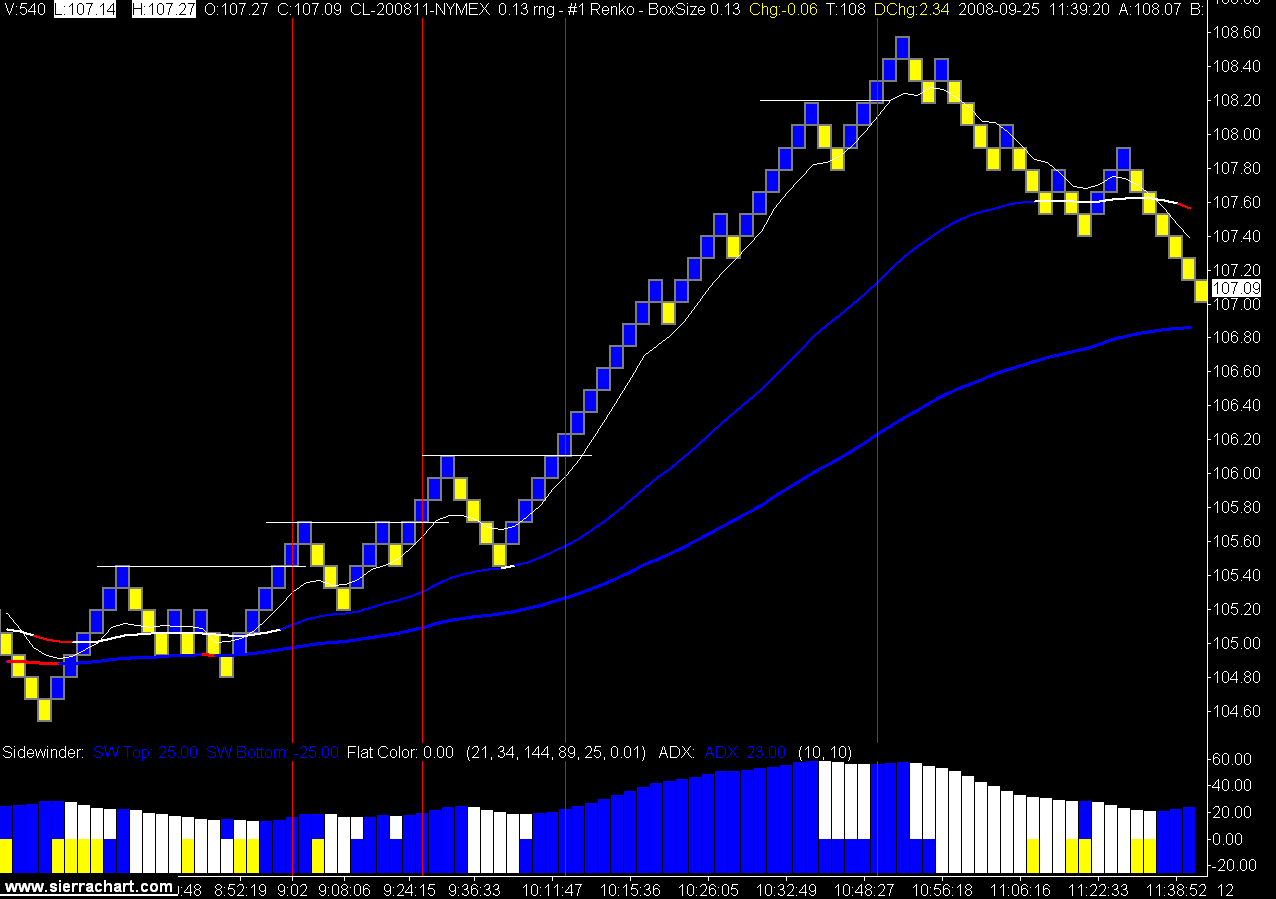
The oil trade was very quiet with a couple of strong long moves today. I was not in the first move as it started to far south. It took 3 cracks before the second long move got going, but going it did get.

I have been taking a look at the YM (Mini Dow) this week as an "exceptional Irish trader" tells me its the thing to trade since the ER2 (Mini Russell) moved to the ICE platform.

My interest is due to the smaller tick value and the idea of a multiple contract system. Not sure if I will proceed, but don't be shocked if you see a YM chart showing up sometime.

9/15/2008

We Know Crude Will Go This Low

Daily Crude Oil Chart


Needless to say it was an interesting day in the markets. As I write this the DOW is down a couple of hundred ticks, Lehman Bros is bankrupt, Merrill Lynch has been purchased by Bank of America, AIG is in trouble, crude oil is down to $95, did I miss anything?

My focus stayed on crude oil, I have been looking at 8 tick renko bar charts for a while now, and traded them today. My rational is to focus on one chart rather than the 5 and 13 tick renko charts.

I always keep a 3 minute chart around, but today traded off the 8 tick renko. Results were mixed as the huge down move happened before the New York session opened. The floor session spent the day floating long and short with no real direction.

8 Tick Crude Oil Renko Bar Charts