Man with real job: So what do you do for a living?
Solfest: I work Wednesdays.
Man with real job: That's it?
Solfest: Yes.
Man with real job: So what do you do the rest of the week?
Solfest: I look forward to Wednesday.
Crude Oil Chart
Showing posts with label crude oil trading. Show all posts
3/10/2010
2/04/2010
2/02/2010
The Porridge is Just Right
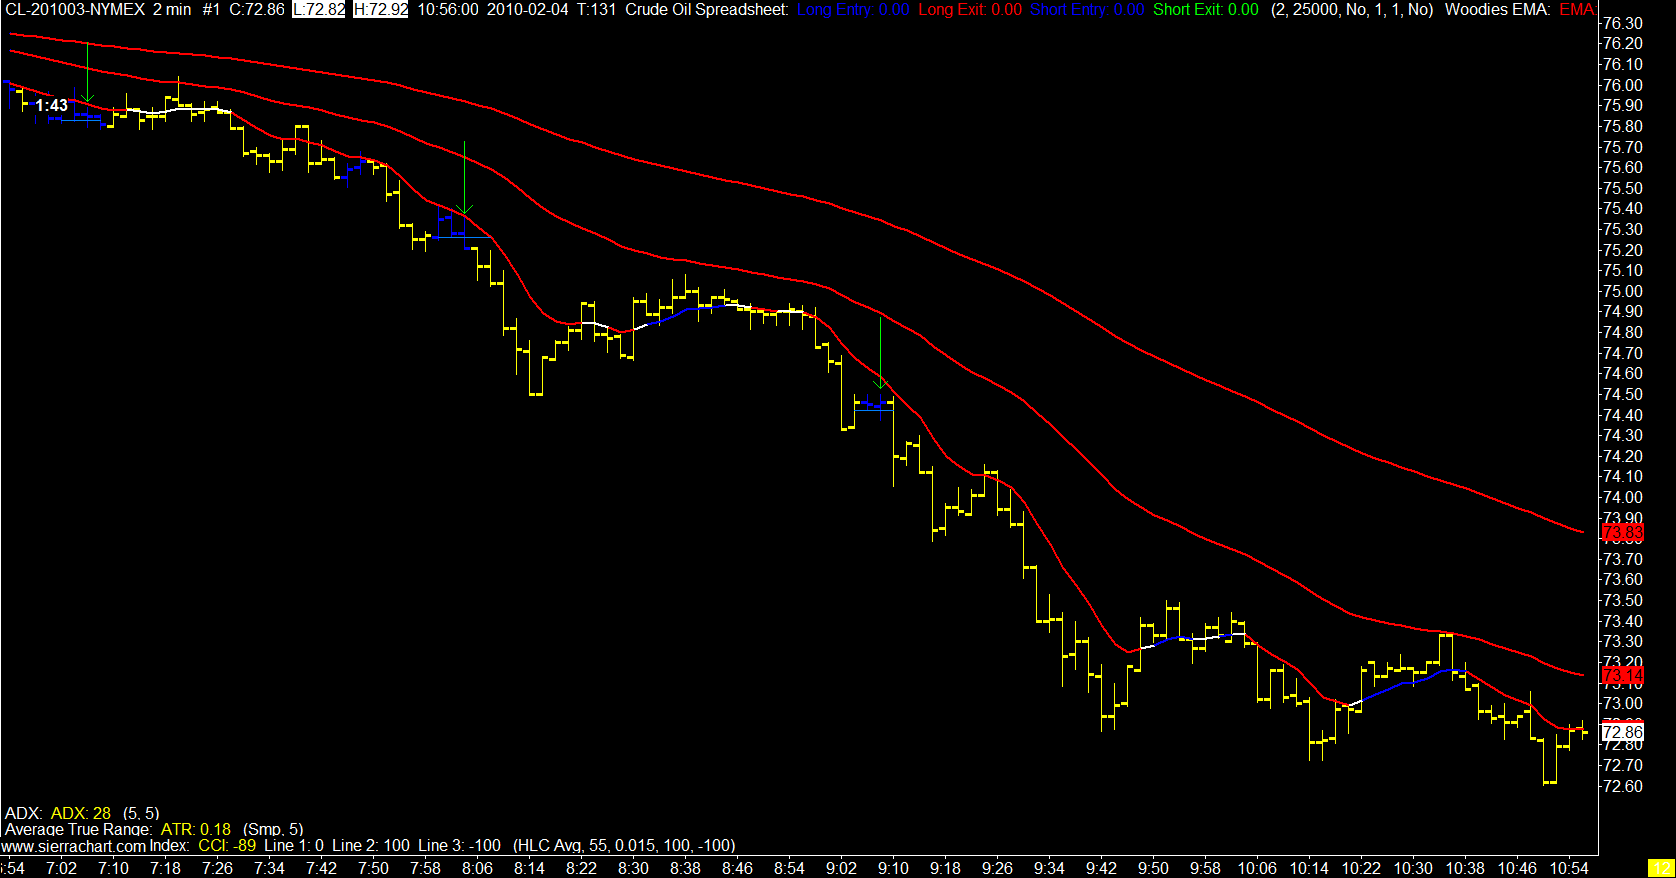
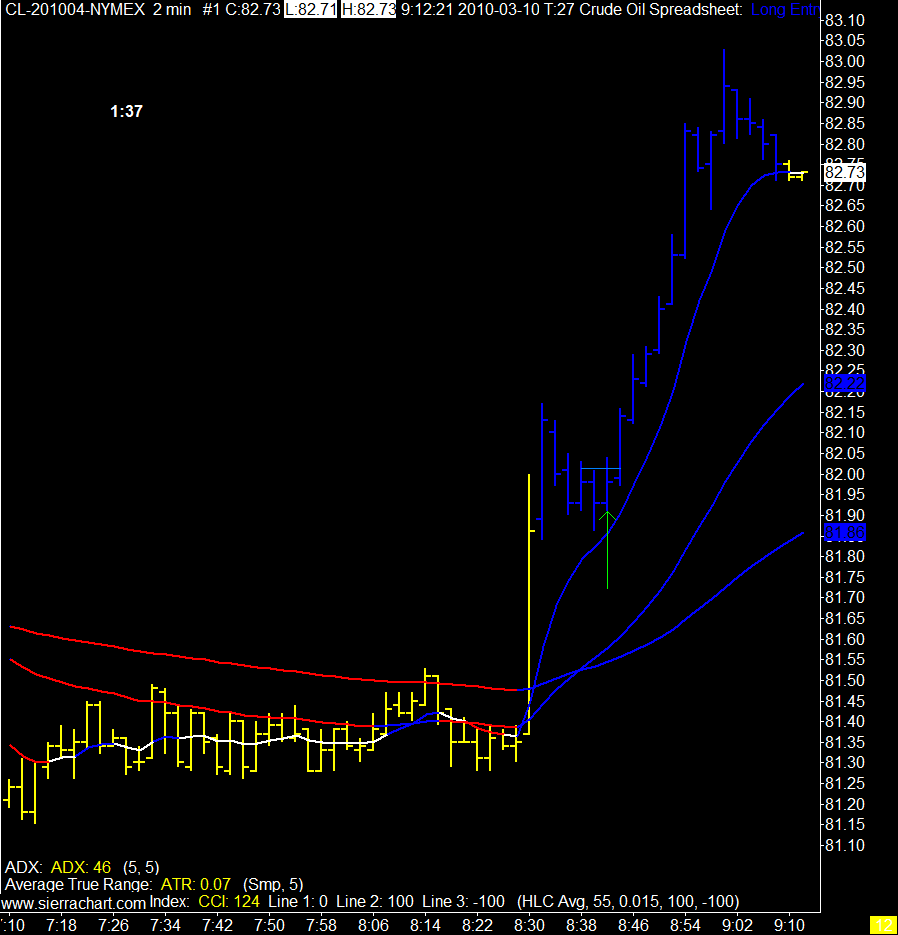
Crude came to life today, don't know why and don't care why.
Ok I do care but since I don't know why I just said I didn't care.
I think I may have stumbled onto a nice system for setting targets. If not "nice" then at least one that is rational. Don't have the stats to back that up but I do have a few years of staring at this thing and have earned a bit of a feel for it.
I hope.
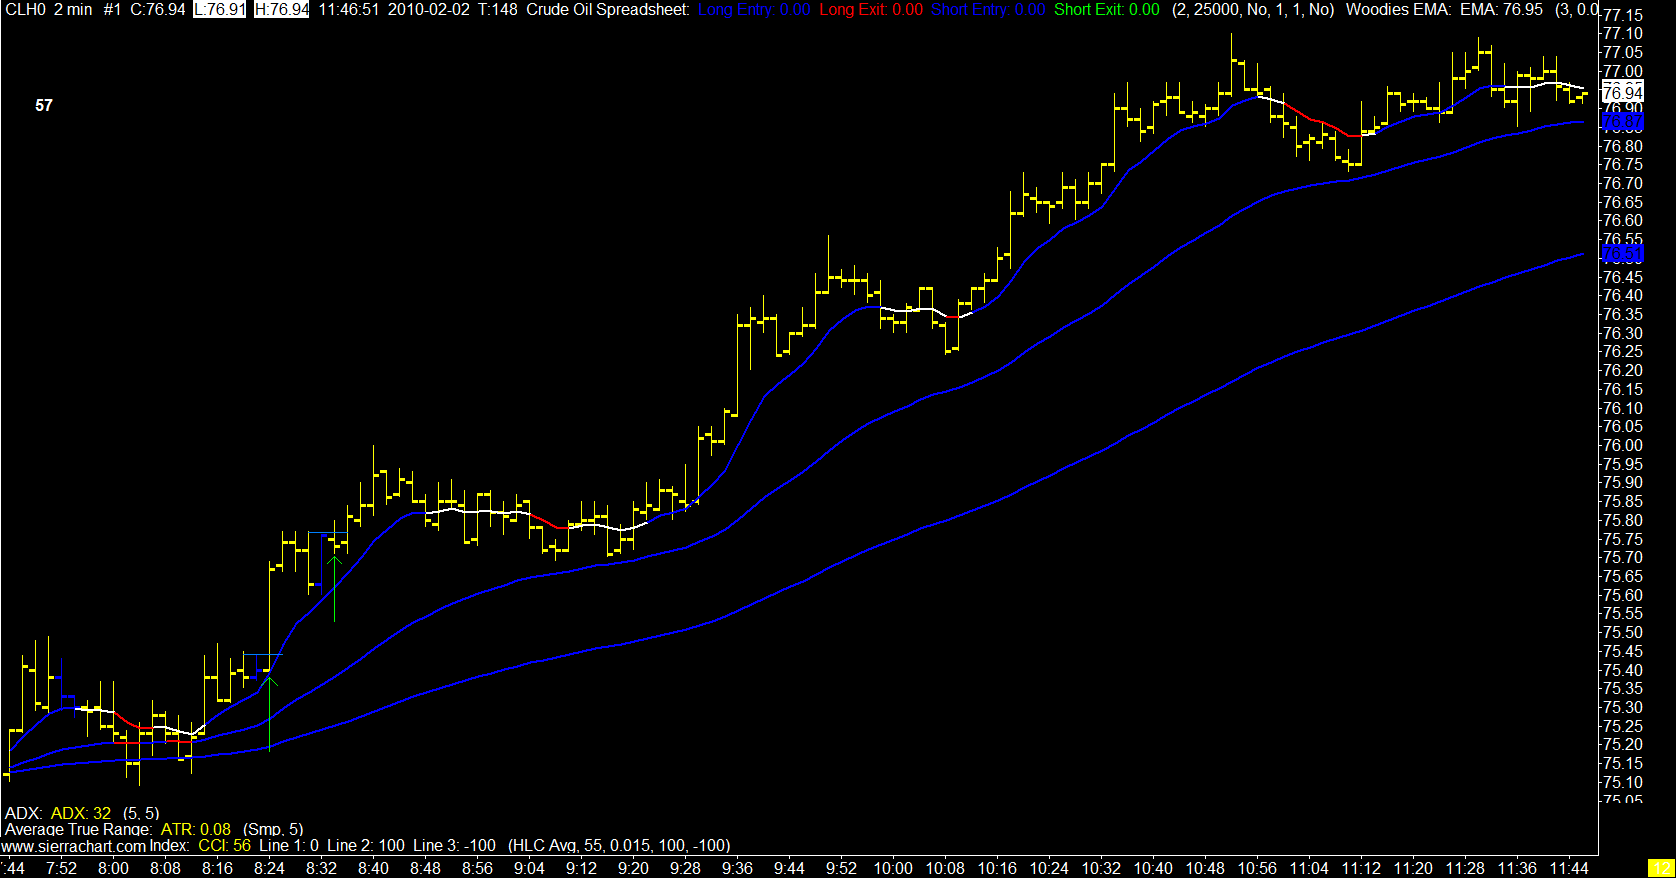
Anyway I am using a percentage the 5 day ATR and then setting the actual target number to the first fib number under that percentage.
Could all be a massive case of recency bias but seems to be working nicely for now.
I only got 2 signals in this massive move up today as the signals stopped due to the EMA spread.
Both hit target and that always makes the "just watching" part of the day a little more relaxing.
2 Minute Crude Oil Chart
Obviously with the right side of the chart filled out I left a lot of porridge on the table today. (and the day's not over) That's ok, the right side of the chart was blank when I exited. I traded my plan my way and it all worked out.
Nice day.
Ok I do care but since I don't know why I just said I didn't care.
I think I may have stumbled onto a nice system for setting targets. If not "nice" then at least one that is rational. Don't have the stats to back that up but I do have a few years of staring at this thing and have earned a bit of a feel for it.
I hope.
Anyway I am using a percentage the 5 day ATR and then setting the actual target number to the first fib number under that percentage.
Could all be a massive case of recency bias but seems to be working nicely for now.
I only got 2 signals in this massive move up today as the signals stopped due to the EMA spread.
Both hit target and that always makes the "just watching" part of the day a little more relaxing.
2 Minute Crude Oil Chart
Obviously with the right side of the chart filled out I left a lot of porridge on the table today. (and the day's not over) That's ok, the right side of the chart was blank when I exited. I traded my plan my way and it all worked out.
Nice day.
11/09/2009
A Blog About......
Trading crude oil!
Right, right, trading crude oil. That's why we're all here. That's why tens of people show up every day, hoping for a glimpse into the exciting world of crude oil trading.
Indeed.
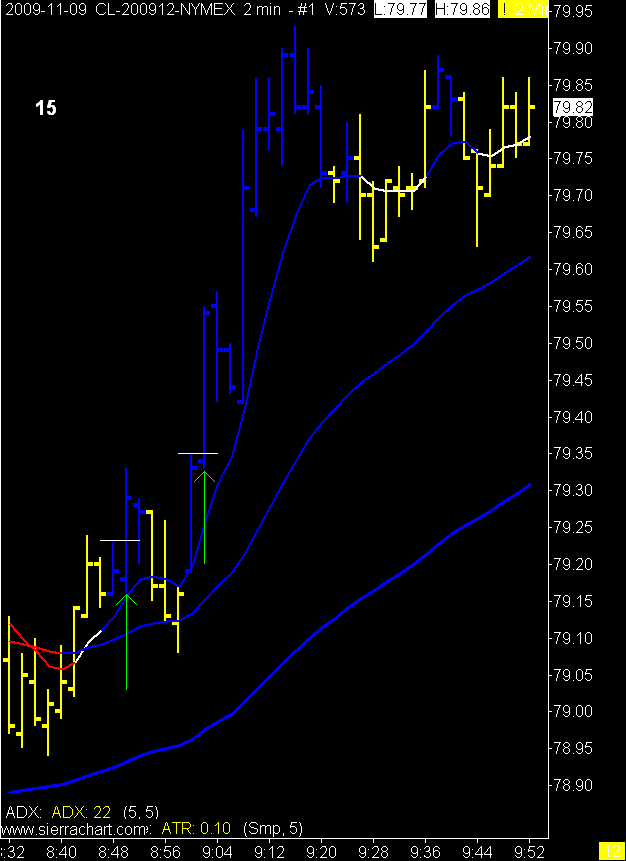
Well here you go, a couple of trades today.
I am working with an old filter for the blue bars. One that I can't figure how to code into the blue bars so I am currently watching 2 charts again.
If it shows any promise I'll let you know.
Hint, part of it appears and disappears off my blue bar chart.
2 Minute Crude Oil Chart
Right, right, trading crude oil. That's why we're all here. That's why tens of people show up every day, hoping for a glimpse into the exciting world of crude oil trading.
Indeed.
Well here you go, a couple of trades today.
I am working with an old filter for the blue bars. One that I can't figure how to code into the blue bars so I am currently watching 2 charts again.
If it shows any promise I'll let you know.
Hint, part of it appears and disappears off my blue bar chart.
2 Minute Crude Oil Chart
8/29/2009
'Over a Barrel, The Truth About Oil'
Interesting story from ABC News 20/20 on America and oil.
(volume is low, so turn it up)
They love to bash speculators and have some interesting things to say about us. To me, a speculator, the story moves to an opinion rather than the "truth about oil" at that point. Every commodity is traded many times over before it hits the consumer, oil just happens to be the most important and is non renewable. Hence over the next 50 years or so price will continue to go up unless some viable alternative to it is found.
If you are in the U.S. you can watch it here.
They brush over the American source of "friendly" oil, namely Canada. I wonder what percentage of Americans know that Canada supplies them with more than double the petroleum than any other country?
American Petroleum Imports
Total Imports of Petroleum (Top 15 Countries)
(Thousand Barrels per Day)
Country YTD 2009
CANADA 2,417
VENEZUELA 1,180
MEXICO 1,274
SAUDI ARABIA 1,084
NIGERIA 679
RUSSIA 638
ALGERIA 484
ANGOLA 547
IRAQ 471
COLOMBIA 283
BRAZIL 356
UNITED KINGDOM 262
VIRGIN ISLANDS 306
KUWAIT 174
NORWAY 136
Source: U.S. Government, Department of Energy, Energy Information Administration
(volume is low, so turn it up)
They love to bash speculators and have some interesting things to say about us. To me, a speculator, the story moves to an opinion rather than the "truth about oil" at that point. Every commodity is traded many times over before it hits the consumer, oil just happens to be the most important and is non renewable. Hence over the next 50 years or so price will continue to go up unless some viable alternative to it is found.
If you are in the U.S. you can watch it here.
They brush over the American source of "friendly" oil, namely Canada. I wonder what percentage of Americans know that Canada supplies them with more than double the petroleum than any other country?
American Petroleum Imports
Crude Oil and Total Petroleum Imports Top 15 Countries
June 2009 Import Highlights: August 28, 2009
Monthly data on the origins of crude oil imports in June 2009 has been released and it shows that three countries exported more than 1.00 million barrels per day to the United States (see table below). The top five exporting countries accounted for 64 percent of United States crude oil imports in June while the top ten sources accounted for approximately 82 percent of all U.S. crude oil imports. The top sources of US crude oil imports for June were Canada (2.001 million barrels per day), Venezuela (1.119 million barrels per day), Mexico (1.099 million barrels per day), Saudi Arabia (0.902 million barrels per day), and Nigeria (0.769 million barrels per day). The rest of the top ten sources, in order, were Angola (0.435 million barrels per day), Iraq (0.374 million barrels per day), Russia (0.305 million barrels per day), Columbia (0.286 million barrels per day), and Brazil (0.269 million barrels per day). Total crude oil imports averaged 9.172 million barrels per day in June, which is an increase of (0.241) million barrels per day from May 2009.
Canada remained the largest exporter of total petroleum in June, exporting 2.529 million barrels per day to the United States, which is an increase from last month (2.206 thousand barrels per day). The second largest exporter of total petroleum was Venezuela with 1.237 million barrels per day.
Total Imports of Petroleum (Top 15 Countries)
(Thousand Barrels per Day)
Country YTD 2009
CANADA 2,417
VENEZUELA 1,180
MEXICO 1,274
SAUDI ARABIA 1,084
NIGERIA 679
RUSSIA 638
ALGERIA 484
ANGOLA 547
IRAQ 471
COLOMBIA 283
BRAZIL 356
UNITED KINGDOM 262
VIRGIN ISLANDS 306
KUWAIT 174
NORWAY 136
Source: U.S. Government, Department of Energy, Energy Information Administration
7/29/2009
I am Genius
Barrel count today.
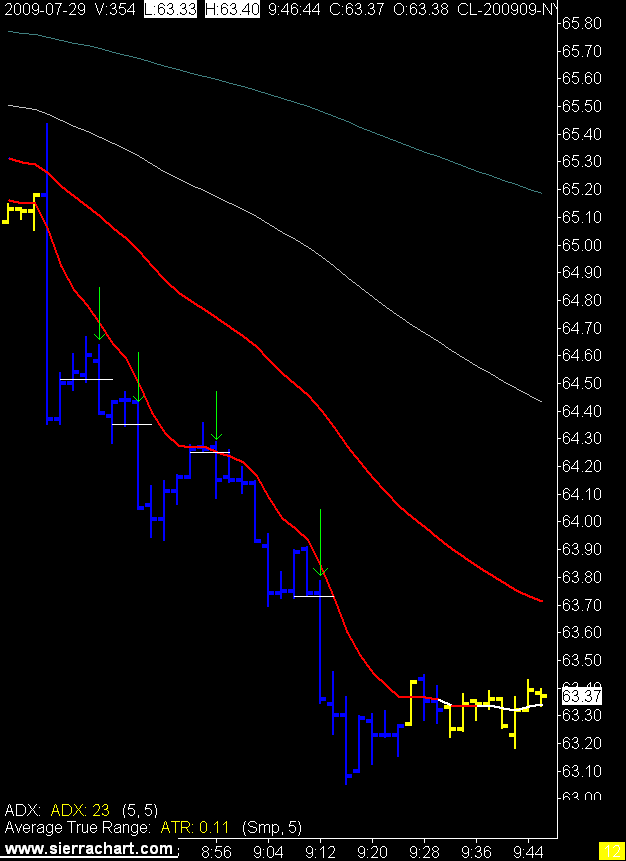
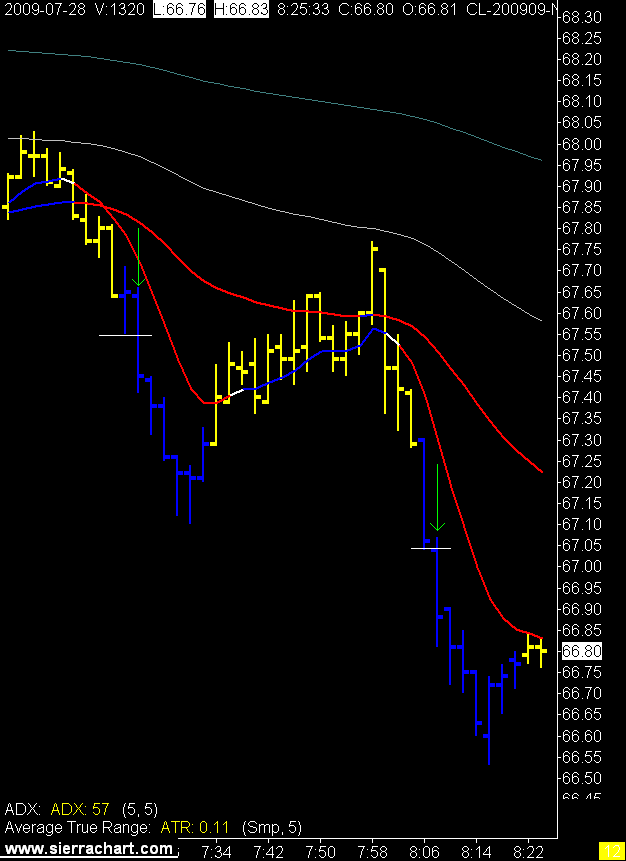
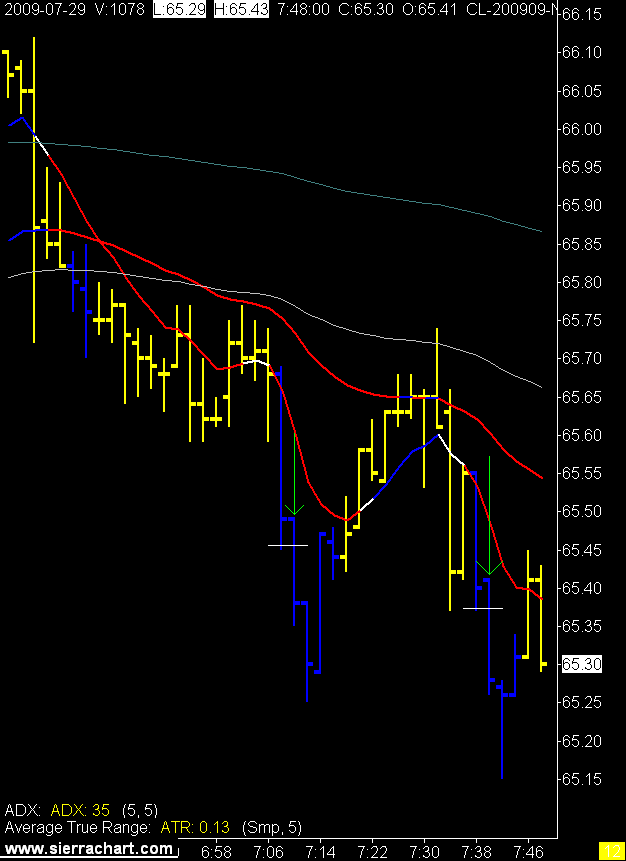
I took a couple of trades before the inventory report and got 2 break evens. Then the report. Wow, I guess they found a few more barrels lying around and price fell off the map. I didn't take the last one as per my plan but it worked as well.
Nice day.
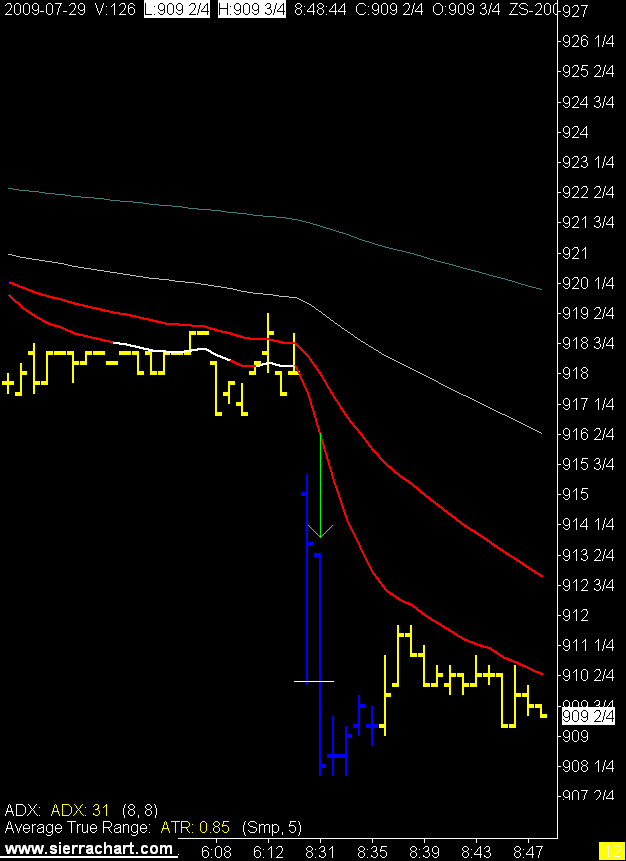
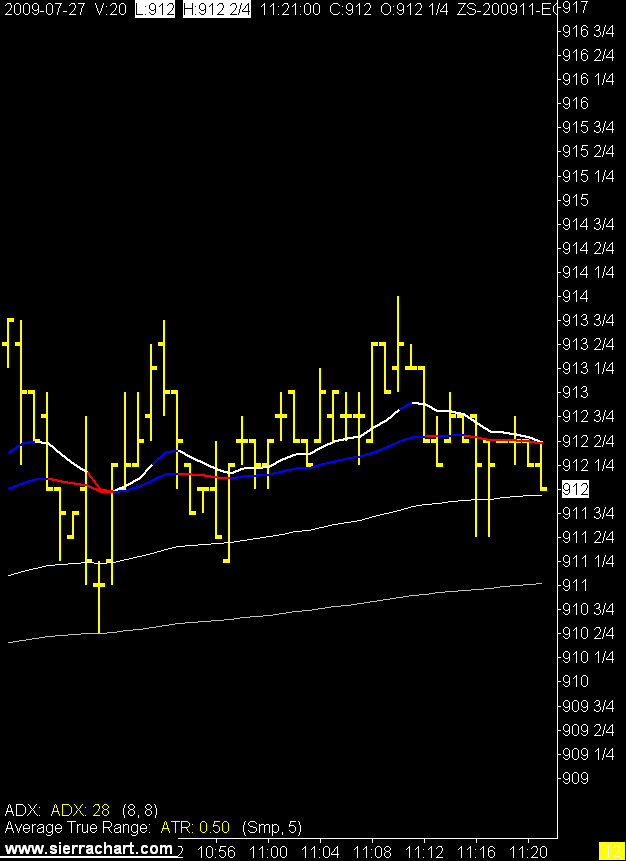
Beans seem awfully quiet this summer but I'm glad I look at both and take whichever is moving.
2 Minute Crude Oil Chart

2 Minute Crude Oil Chart

1 Minute Soybean Chart
I took a couple of trades before the inventory report and got 2 break evens. Then the report. Wow, I guess they found a few more barrels lying around and price fell off the map. I didn't take the last one as per my plan but it worked as well.
Nice day.
Beans seem awfully quiet this summer but I'm glad I look at both and take whichever is moving.
2 Minute Crude Oil Chart

2 Minute Crude Oil Chart

1 Minute Soybean Chart
7/28/2009
Change
I did peek a little at charts while on holidays, which was a mistake, and found myself squinting at little charts on my laptop. This got me to thinking about getting the CL trading down to one chart instead of two.
I only use the one minute chart for soybeans but have found with crude oil I need to see trend and range on both the three and one minute charts in order to stay out of trouble. Besides having to watch two charts I have also found that when I see blue on one of the charts I want to hit the button rather than waiting for conformation from the second chart.
So being the quantitative genius that I am I added one minute to three minutes, divided by two and came up with a 2 minute chart.
Still playing with the ADX and ATR settings but found a couple of nice trades today. The trend was so strong this morning blind monkeys could have made money today. Only time will tell if the settings will keep me out of the flats and in the trends.
2 Minute Crude Oil Chart
I only use the one minute chart for soybeans but have found with crude oil I need to see trend and range on both the three and one minute charts in order to stay out of trouble. Besides having to watch two charts I have also found that when I see blue on one of the charts I want to hit the button rather than waiting for conformation from the second chart.
So being the quantitative genius that I am I added one minute to three minutes, divided by two and came up with a 2 minute chart.
Still playing with the ADX and ATR settings but found a couple of nice trades today. The trend was so strong this morning blind monkeys could have made money today. Only time will tell if the settings will keep me out of the flats and in the trends.
2 Minute Crude Oil Chart
Labels:
2 minute crude oil chart,
ADX,
ATR,
crude oil trading
7/27/2009
Pretty and Ugly
I'm home.
I know that because I'm not looking at this anymore.


I'm looking at this.
1 Minute Soybean Chart

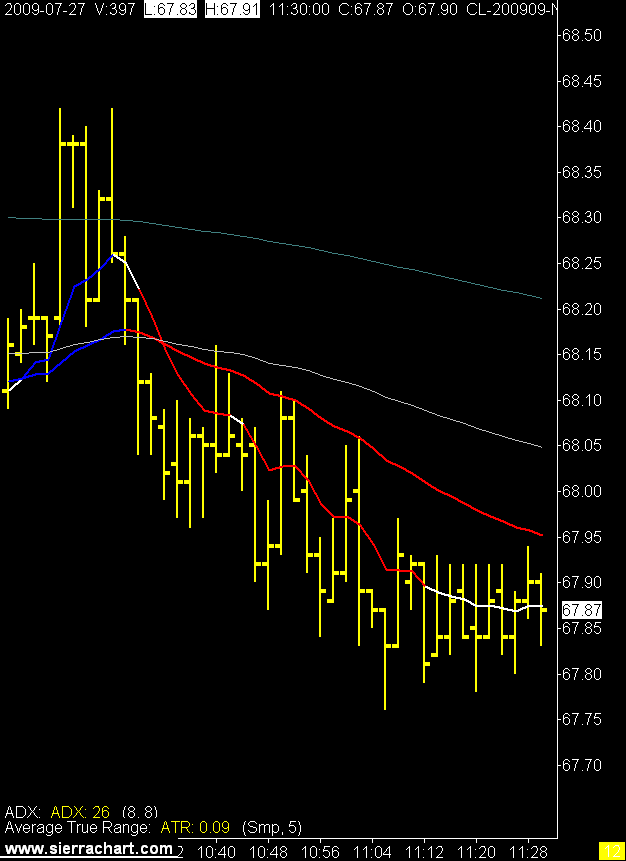
2 Minute Crude Oil Chart
I know that because I'm not looking at this anymore.
I'm looking at this.
1 Minute Soybean Chart

2 Minute Crude Oil Chart
3/18/2009
Oil Inventory
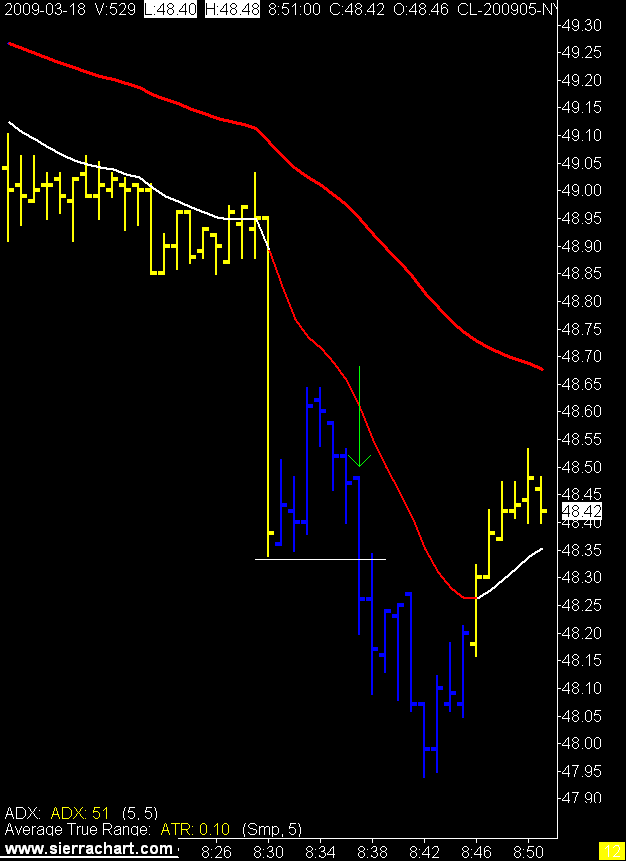
I don't know if it would shock anyone that I don't listen to or watch the weekly oil inventory report when it is first released. I know when it's coming and I do not trade in front of it, but I don't need to know what it says when it's released.
I just follow the chart.
Hit target with this trade after the report and didn't have anything else line up for the rest of the day.
I watched the YM when the Fed announcement came out and it seemed to like whatever the Fed had to say. Has the DOW put in the bottom on this bear market?
1 Minute Crude Oil Chart
I just follow the chart.
Hit target with this trade after the report and didn't have anything else line up for the rest of the day.
I watched the YM when the Fed announcement came out and it seemed to like whatever the Fed had to say. Has the DOW put in the bottom on this bear market?
1 Minute Crude Oil Chart
3/04/2009
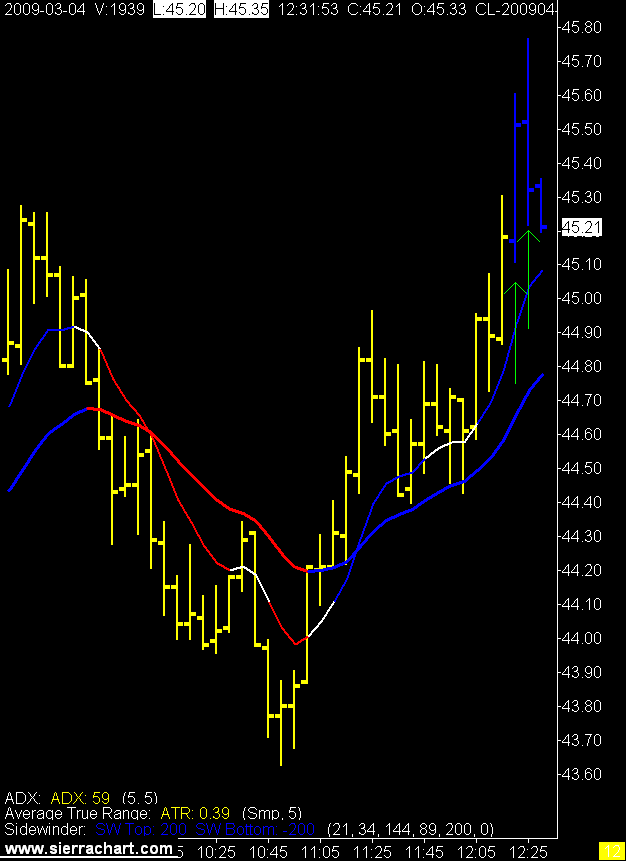
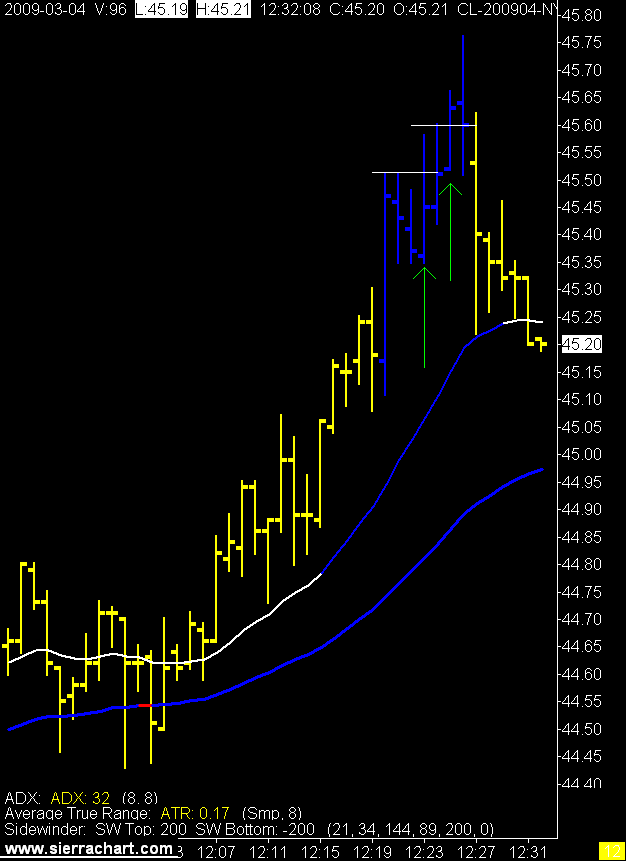
Stupid Blue Bars
2/20/2009
Another Long Day
One signal two trades. :)
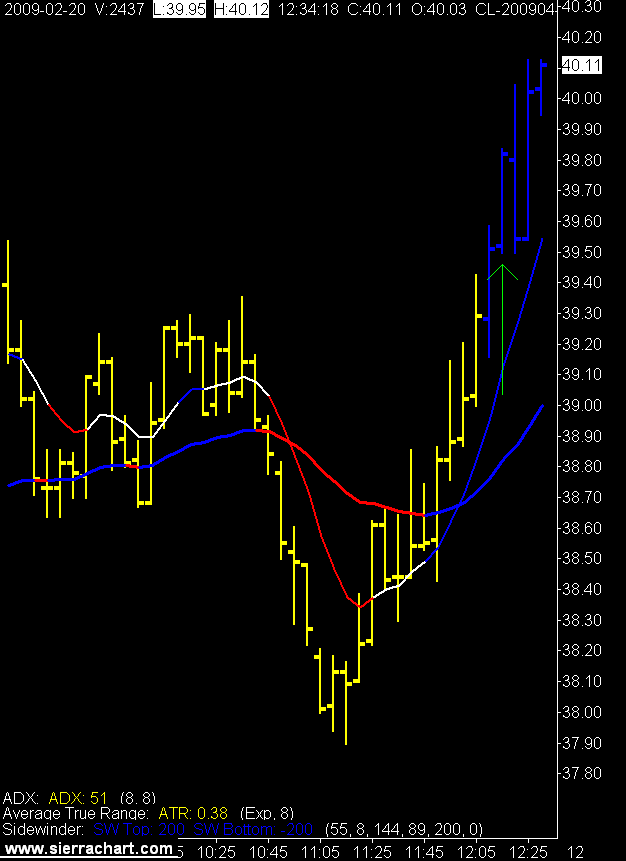
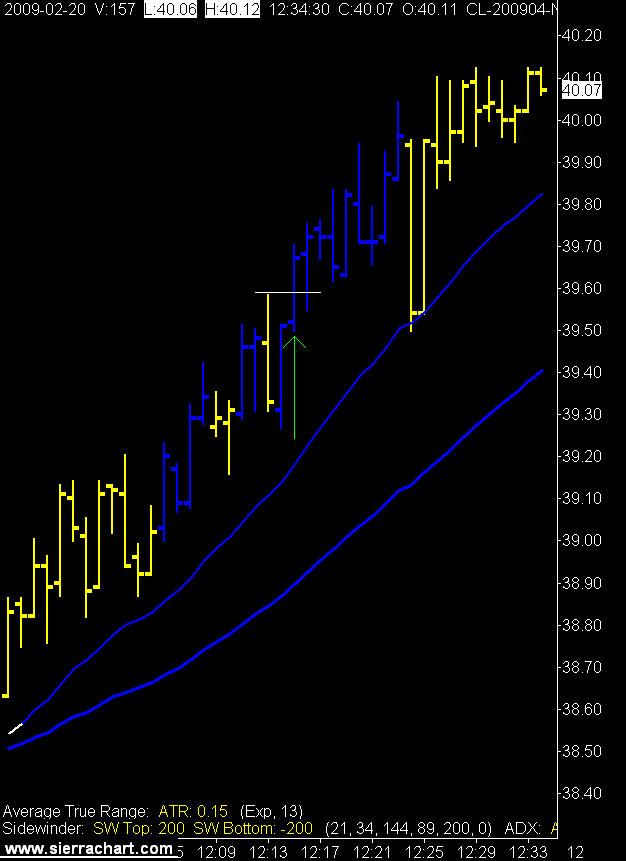
The non signal trade was blue on the 1 minute but not on the 5 minute. You have my sincere apologies. The signal trade was a slow one and came within 3 tics of target. Trailing stop exit.
Yes indeed, a rather long day for little reward.
I wonder what blue bars look like on a gold chart?
5 Minute Crude Oil Chart

1 Minute Crude Oil Chart

Some good video on the old blog this week. Have a nice weekend and give them a watch.
The non signal trade was blue on the 1 minute but not on the 5 minute. You have my sincere apologies. The signal trade was a slow one and came within 3 tics of target. Trailing stop exit.
Yes indeed, a rather long day for little reward.
I wonder what blue bars look like on a gold chart?
5 Minute Crude Oil Chart

1 Minute Crude Oil Chart

Some good video on the old blog this week. Have a nice weekend and give them a watch.
2/19/2009
Startled into Action
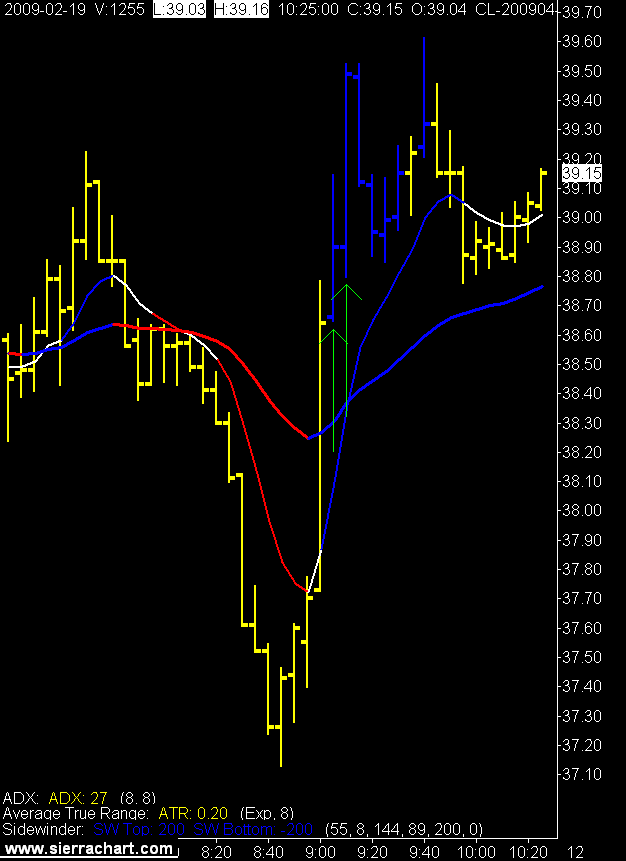
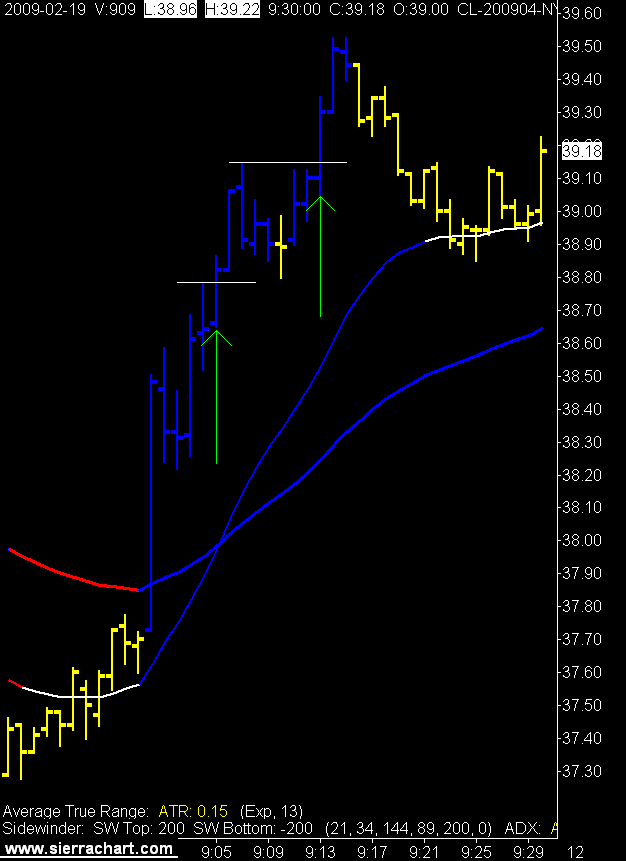
A couple of signals today, not sure if I just didn't trade them well or if I got all my system can give. Got a break even and a trailing stop for a small positive day.
Felt like I should have done better based on the the post trade review. That could be due to the shortage of signals lately as you feel the need to cash in when something does show up.
Hopefully tomorrow is as active as the last 2 Fridays.
5 Minute Crude Oil Chart

1 Minute Crude Oil Chart
Felt like I should have done better based on the the post trade review. That could be due to the shortage of signals lately as you feel the need to cash in when something does show up.
Hopefully tomorrow is as active as the last 2 Fridays.
5 Minute Crude Oil Chart

1 Minute Crude Oil Chart
2/13/2009
Another Unique Moment in Time
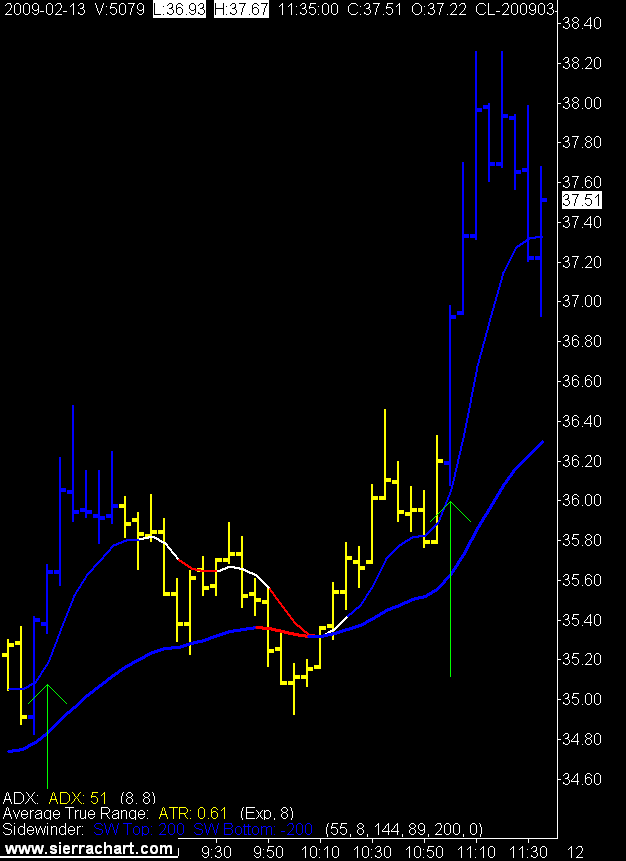
Nice day to trade today with a power move up in the afternoon session. That's two nice Fridays in a row.
Strange.
In this business you have to expect anything and everything at anytime. No bias allowed.
5 Minute Crude Oil Chart

1 Minute Crude Oil Chart

I did a little culling in the blog list today. I don't mind if you don't reciprocate a link, but if you don't post, you're just taking up space.
If anyone knows of a great trading blog let me know. I would like to add day traders who trade crude oil or any other futures contracts. Preferably ones that don't feel the need to drop the f bomb every second word. Yes I'm speaking to you Dinosaur Trader. Great trader, great writer, why diminish when you have the ability to distinguish.
While your at it feel free to tell me anything else you would like to see more of, or less of on the blog.
Have a nice long weekend.
Strange.
In this business you have to expect anything and everything at anytime. No bias allowed.
5 Minute Crude Oil Chart

1 Minute Crude Oil Chart

I did a little culling in the blog list today. I don't mind if you don't reciprocate a link, but if you don't post, you're just taking up space.
If anyone knows of a great trading blog let me know. I would like to add day traders who trade crude oil or any other futures contracts. Preferably ones that don't feel the need to drop the f bomb every second word. Yes I'm speaking to you Dinosaur Trader. Great trader, great writer, why diminish when you have the ability to distinguish.
While your at it feel free to tell me anything else you would like to see more of, or less of on the blog.
Have a nice long weekend.
10/03/2008
Congress Passes Historic Bill.... Yawn
"Dang, the market was supposed to go up.
We can't have a recession, we don't want a recession, things are supposed to go up, they always go up, why aren't they going up?
Stupid economy." American Politician
Ok maybe it's more of a paraphrase. :)
The only quiver left in the U.S arsenal are interest rate cuts, 2.00% left to go until they hit zero.
Then what?
On the brighter side we now see survivor banks (Citibank & Wells Fargo) competing over a non survivor bank (Wachovia). This is a good sign, in fact this is how capitalism is supposed to work.
The strong eat the weak.
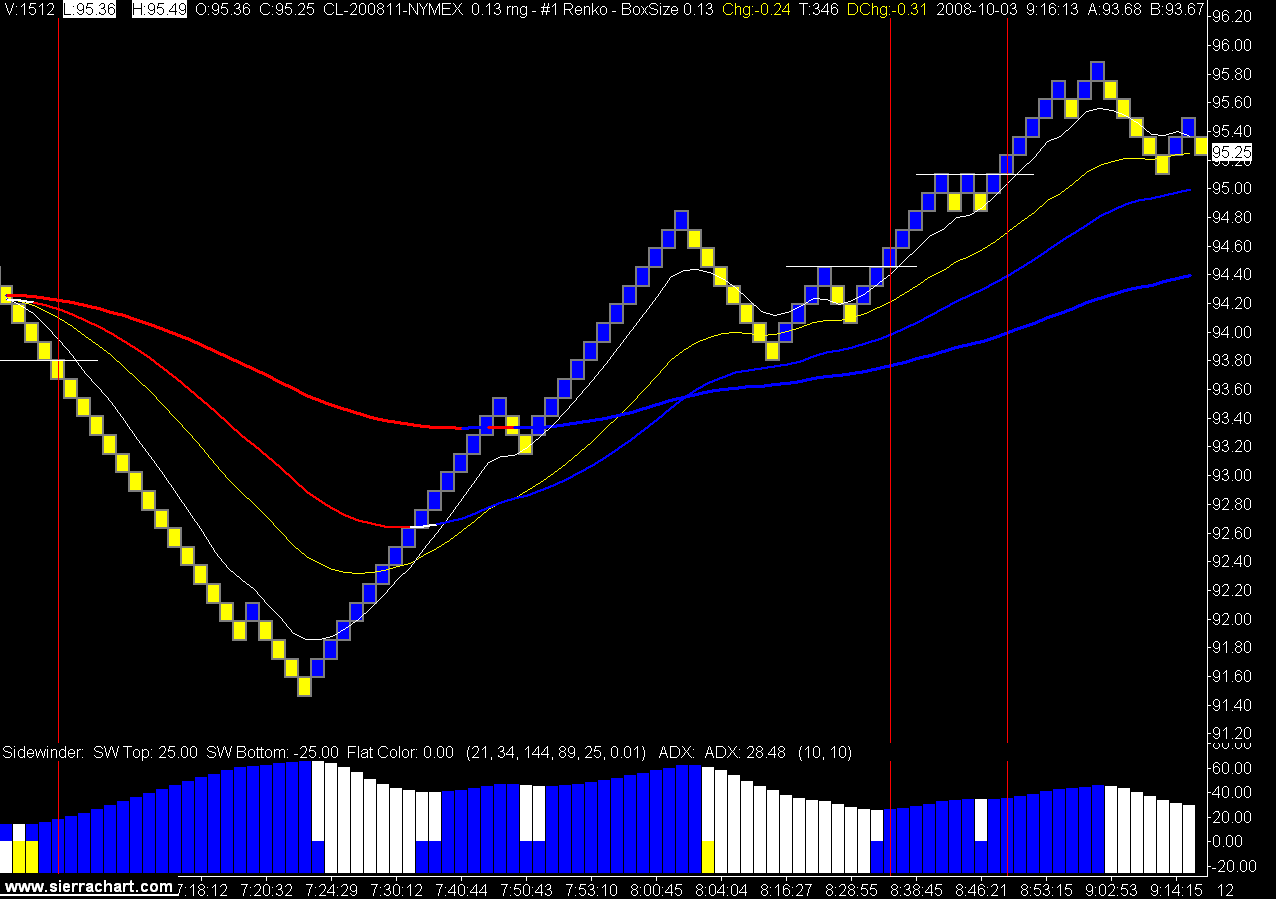
Crude oil had some nice moves today. I got stopped out of the first one and will have nightmares over that one all weekend. Caught some cheese on the others and had a nice day.
13 Tick Crude Oil Renko Bar Charts (click on chart to view)

We can't have a recession, we don't want a recession, things are supposed to go up, they always go up, why aren't they going up?
Stupid economy." American Politician
Ok maybe it's more of a paraphrase. :)
The only quiver left in the U.S arsenal are interest rate cuts, 2.00% left to go until they hit zero.
Then what?
On the brighter side we now see survivor banks (Citibank & Wells Fargo) competing over a non survivor bank (Wachovia). This is a good sign, in fact this is how capitalism is supposed to work.
The strong eat the weak.
Crude oil had some nice moves today. I got stopped out of the first one and will have nightmares over that one all weekend. Caught some cheese on the others and had a nice day.
13 Tick Crude Oil Renko Bar Charts (click on chart to view)

Labels:
citibank,
crude oil trading,
wachovia,
wells fargo
9/25/2008
Crude Oil Trades
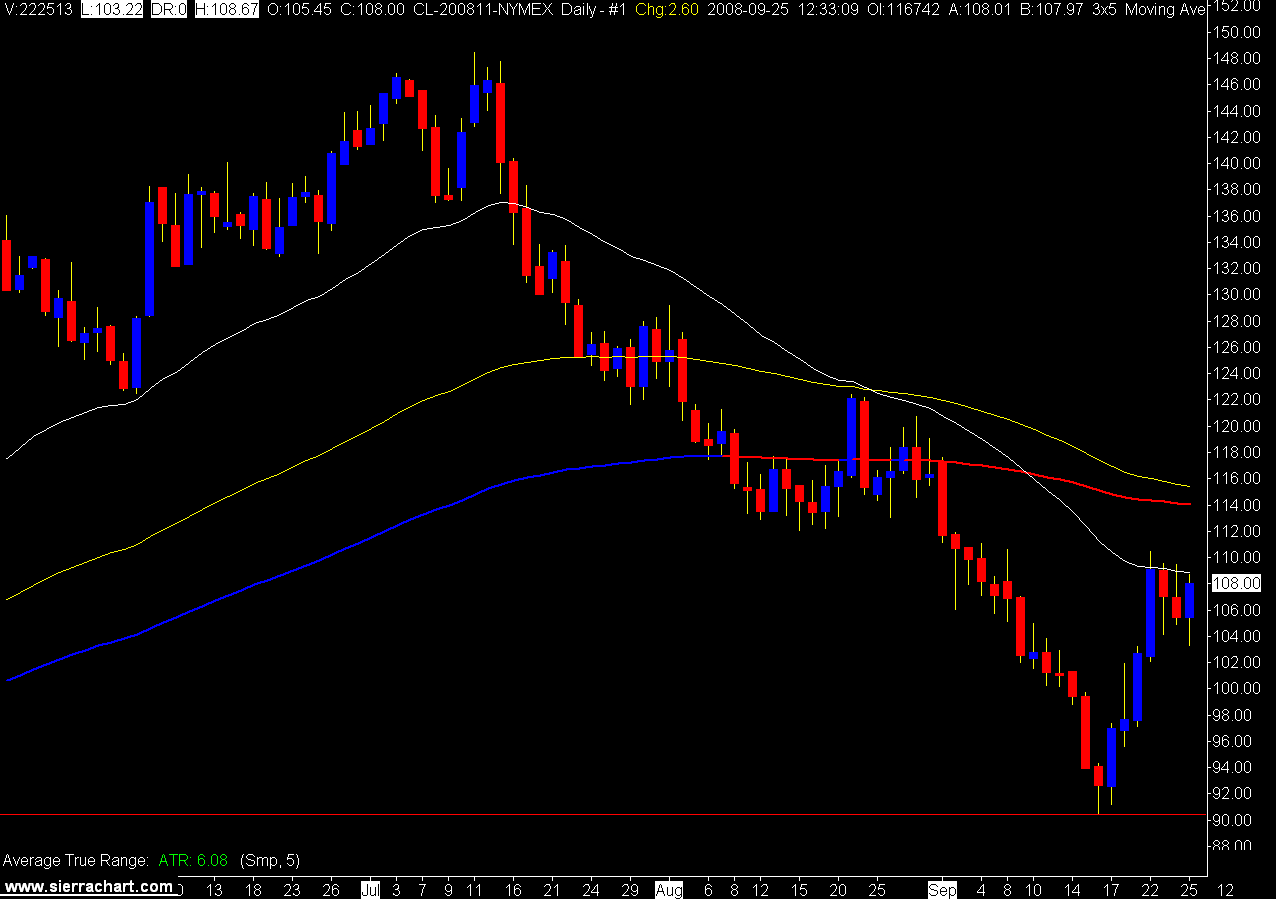
Daily Crude Oil Chart (click on chart to view)

The daily chart has run into the 34 EMA (white line) and looks like it could revert back to the downside. Either that or its waiting for the U.S bailout package to be finalized and all will be well in the neighborhood.
I think demand for oil will continue to drop, and when the gulf production gets back to 100% oil could be headed south.
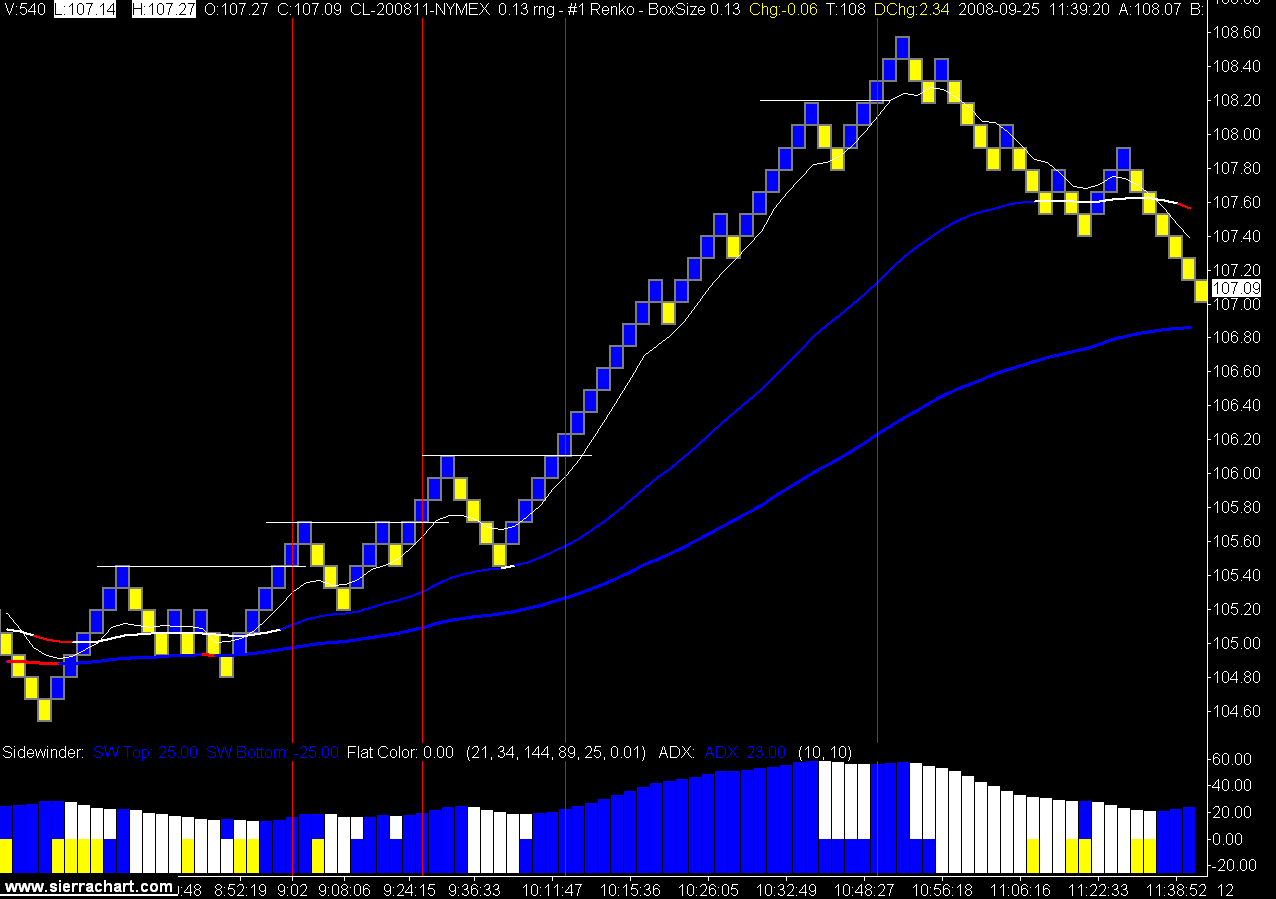
13 Tick Crude Oil Renko Chart

The oil trade was very quiet with a couple of strong long moves today. I was not in the first move as it started to far south. It took 3 cracks before the second long move got going, but going it did get.
I have been taking a look at the YM (Mini Dow) this week as an "exceptional Irish trader" tells me its the thing to trade since the ER2 (Mini Russell) moved to the ICE platform.
My interest is due to the smaller tick value and the idea of a multiple contract system. Not sure if I will proceed, but don't be shocked if you see a YM chart showing up sometime.

The daily chart has run into the 34 EMA (white line) and looks like it could revert back to the downside. Either that or its waiting for the U.S bailout package to be finalized and all will be well in the neighborhood.
I think demand for oil will continue to drop, and when the gulf production gets back to 100% oil could be headed south.
13 Tick Crude Oil Renko Chart

The oil trade was very quiet with a couple of strong long moves today. I was not in the first move as it started to far south. It took 3 cracks before the second long move got going, but going it did get.
I have been taking a look at the YM (Mini Dow) this week as an "exceptional Irish trader" tells me its the thing to trade since the ER2 (Mini Russell) moved to the ICE platform.
My interest is due to the smaller tick value and the idea of a multiple contract system. Not sure if I will proceed, but don't be shocked if you see a YM chart showing up sometime.
8/20/2008
Oil is Up, Down, Up
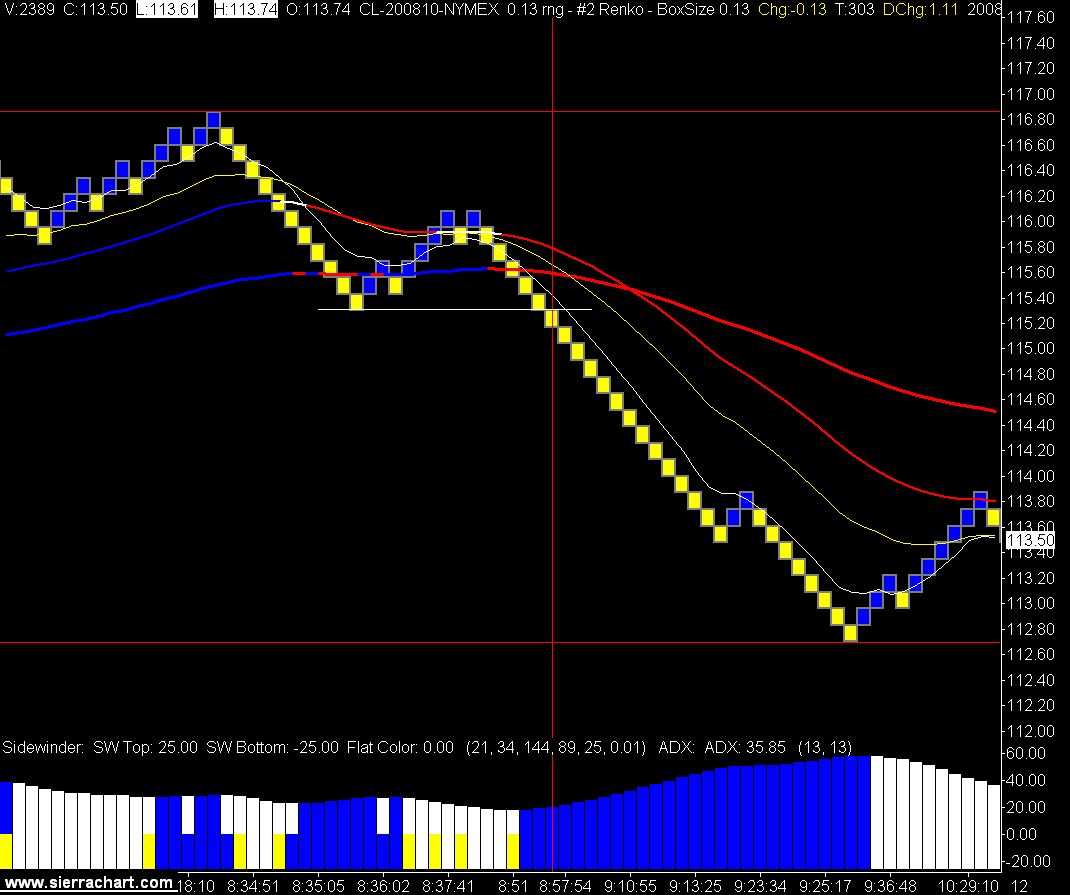
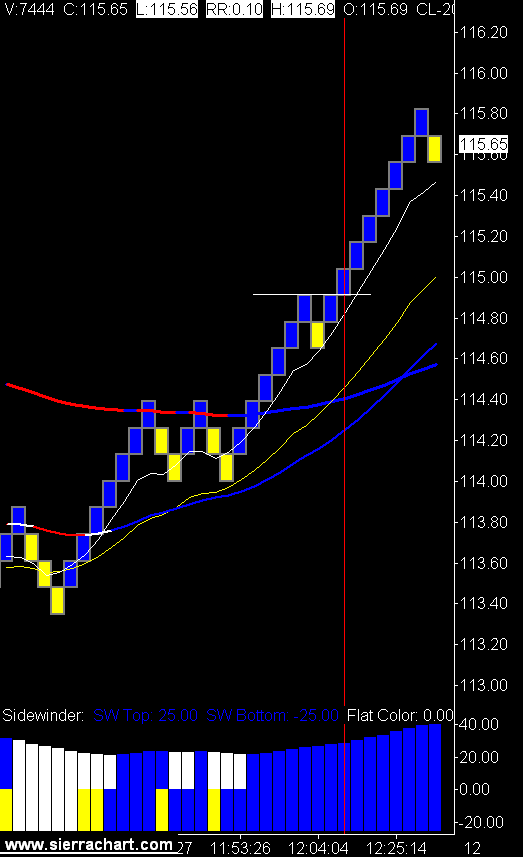
Oil traded all over the map today with a high of $117 before the crude oil inventory report. After the report we saw a drop down to $112.60 and then a rally up to $115.81 as the New York session closed.
I did not trade before the report, usually a wise decision, and caught a good portion of the down move. Took 2 swings to get long at the end of the session with a full stop and then a nice winner to end the day.
I'm using a 5 tick Renko bar chart to help find an entry point on the trend I see with the 13 tick Renko chart.
All in all a nice day.
13 Tick Renko Crude Oil Chart (click on chart to view)

I did not trade before the report, usually a wise decision, and caught a good portion of the down move. Took 2 swings to get long at the end of the session with a full stop and then a nice winner to end the day.
I'm using a 5 tick Renko bar chart to help find an entry point on the trend I see with the 13 tick Renko chart.
All in all a nice day.
13 Tick Renko Crude Oil Chart (click on chart to view)

6/10/2008
Wild Trading
The crude oil market was always considered to be volatile, so this market would have to be called something else.
Wild is one description. As I stated in an earlier post you either have to raise your stops or stop trading until this market cools down.
My measure of volatility is the daily 5 period average true range and it is currently running is dollars terms at $6,370.00. That is the largest range I have ever seen in crude oil.
Of course that ATR number has the Friday $10,000 plus range in it, but still this range / volatility is huge and should not be ignored by traders as it changes the whole market place you trade in.
If you did not know what product you were trading and had not been in the market for the past 2 weeks you would not believe that this was the same product you were trading 2 weeks ago. 14 days ago the 5 day CL ATR was $3,930.00.
So with that in mind if your trading is not working, it is not working for a reason.
The market has changed.
So what do you do?
One other method that can stand beside raising your stops is increasing the format in which you view the market. If you normally trade a 144 tick chart move up to a 233tick chart, if you trade a 3 minute chart move up to a 5 minute, etc.
At the very least keep your eye on a higher time frame market and wait for trend on it before you look at an entry on the shorter time frame chart.
If you don't want to risk dollars in a different time frame try simming it for a while and see how it works.
Remember you don't have to trade, and a day with no live trades is a break even day, which for some may be an improvement on past results.
Wild is one description. As I stated in an earlier post you either have to raise your stops or stop trading until this market cools down.
My measure of volatility is the daily 5 period average true range and it is currently running is dollars terms at $6,370.00. That is the largest range I have ever seen in crude oil.
Of course that ATR number has the Friday $10,000 plus range in it, but still this range / volatility is huge and should not be ignored by traders as it changes the whole market place you trade in.
If you did not know what product you were trading and had not been in the market for the past 2 weeks you would not believe that this was the same product you were trading 2 weeks ago. 14 days ago the 5 day CL ATR was $3,930.00.
So with that in mind if your trading is not working, it is not working for a reason.
The market has changed.
So what do you do?
One other method that can stand beside raising your stops is increasing the format in which you view the market. If you normally trade a 144 tick chart move up to a 233tick chart, if you trade a 3 minute chart move up to a 5 minute, etc.
At the very least keep your eye on a higher time frame market and wait for trend on it before you look at an entry on the shorter time frame chart.
If you don't want to risk dollars in a different time frame try simming it for a while and see how it works.
Remember you don't have to trade, and a day with no live trades is a break even day, which for some may be an improvement on past results.
6/03/2008
Trading Survival 101
Crude Oil Chart (click on chart to view)

Today was tough trading with a slow gradual decline in the market throughout the day. In hindsight the trade for today was get short at NYMEX open and flat at NYMEX close.
However that is easy to see now.
How does a trader survive periods like this, when the signals are getting stopped and the winners are not running?
Risk Management.
A sound risk management policy is required by all traders to preserve capital, as a trader without capital is a trader looking for a job. This is the most important policy in the start up phase of the trading business. Without sound risk management rules, and adherence to those rules the business will not survive.
Our thesis for the risk management policy is based on the principal that capital is scarce. If capital was not scarce it would have no value. We are willing to accept the trade off of lower overall returns by not trading all signals if we have hit our daily, weekly, or monthly stop in order to reduce our “risk of ruin”.
One of the key success factors of the successful trader is sufficient capital. The risk management policy is in place to ensure that capital remains sufficient.
We have seen large financial institutions fail (Barings Bank & Long Term Capital Management) or almost fail (Societe Generale) due to “rogue traders” or position sizing issues. These billion dollar institutions had large and robust risk management / compliance departments on hand and still failed to stop multi billion dollar trading losses.
The individual trader has no such department, if you choose to ignore your risk management rules no one will stop you. Thus the discipline to adhere to your rules will be the determining factor in your success or failure.
Our Risk Management Policy is as follows:
1) Trading capital on hand must equal to two times the minimum overnight margin required per contract traded.
2) The per trade stop loss percentage is set at maximum of 0.60% on each trade and is based on a percentage of the total trading capital
3) Weekly stop loss is set at a maximum 6.00% of total trading capital. If this threshold is hit in a Monday – Friday period trading for that week stops.
4) Monthly stop loss is set at a maximum of 10.00%. If this threshold is hit in a calendar month trading for that month stops.
5) If any of the trade plan’s rules are not adhered to, trading for that day stops.
6) Sim trading the plan can continue if a stop limit has been hit.
These are rules that we use, if you use similar rules your percentages could be quite different. The key is to have some idea of when to stop, before your broker stops you.

Today was tough trading with a slow gradual decline in the market throughout the day. In hindsight the trade for today was get short at NYMEX open and flat at NYMEX close.
However that is easy to see now.
How does a trader survive periods like this, when the signals are getting stopped and the winners are not running?
Risk Management.
A sound risk management policy is required by all traders to preserve capital, as a trader without capital is a trader looking for a job. This is the most important policy in the start up phase of the trading business. Without sound risk management rules, and adherence to those rules the business will not survive.
Our thesis for the risk management policy is based on the principal that capital is scarce. If capital was not scarce it would have no value. We are willing to accept the trade off of lower overall returns by not trading all signals if we have hit our daily, weekly, or monthly stop in order to reduce our “risk of ruin”.
One of the key success factors of the successful trader is sufficient capital. The risk management policy is in place to ensure that capital remains sufficient.
We have seen large financial institutions fail (Barings Bank & Long Term Capital Management) or almost fail (Societe Generale) due to “rogue traders” or position sizing issues. These billion dollar institutions had large and robust risk management / compliance departments on hand and still failed to stop multi billion dollar trading losses.
The individual trader has no such department, if you choose to ignore your risk management rules no one will stop you. Thus the discipline to adhere to your rules will be the determining factor in your success or failure.
Our Risk Management Policy is as follows:
1) Trading capital on hand must equal to two times the minimum overnight margin required per contract traded.
2) The per trade stop loss percentage is set at maximum of 0.60% on each trade and is based on a percentage of the total trading capital
3) Weekly stop loss is set at a maximum 6.00% of total trading capital. If this threshold is hit in a Monday – Friday period trading for that week stops.
4) Monthly stop loss is set at a maximum of 10.00%. If this threshold is hit in a calendar month trading for that month stops.
5) If any of the trade plan’s rules are not adhered to, trading for that day stops.
6) Sim trading the plan can continue if a stop limit has been hit.
These are rules that we use, if you use similar rules your percentages could be quite different. The key is to have some idea of when to stop, before your broker stops you.
5/21/2008
Crude Oil Trades Over $133
I have run out of adjectives to describe crude oil prices. Lets just say they went up.
There were several opportunities to get long today, I got in on the first move up and then passed on the rest of the signals. The signals after winning trade did not provide much of anything until the last 10 minutes of the NYMEX floor session.
Does that mean I was smart not to take them?
No.
The fear and greed complex in trading is always at work, even when a trader has a nice profit. Instead of using the greed side and trading all the signals as I should of, I let the fear side enter in and say "no more trades".
With money in the bank you can justify this position, but, when the signals are not working and the losers start to stack up guess what happens?
The greed factor kicks in and says "keep trading, you'll get it back".
Wrong.
This is when you need the fear factor to make you stop. No more losers.
That is the rational for the trader needing to reverse the human fear and greed instincts in order to have any success in this business.
The inability to do so is the key theme for trading failure.
Trading is not about systems, it is not about indicators, it is all about money management and the battle inside your head.
Don't enter the war until you have properly equipped the army.
34 Tick Range Bar Chart (click on chart to view)

13 Tick Range Bar Chart
There were several opportunities to get long today, I got in on the first move up and then passed on the rest of the signals. The signals after winning trade did not provide much of anything until the last 10 minutes of the NYMEX floor session.
Does that mean I was smart not to take them?
No.
The fear and greed complex in trading is always at work, even when a trader has a nice profit. Instead of using the greed side and trading all the signals as I should of, I let the fear side enter in and say "no more trades".
With money in the bank you can justify this position, but, when the signals are not working and the losers start to stack up guess what happens?
The greed factor kicks in and says "keep trading, you'll get it back".
Wrong.
This is when you need the fear factor to make you stop. No more losers.
That is the rational for the trader needing to reverse the human fear and greed instincts in order to have any success in this business.
The inability to do so is the key theme for trading failure.
Trading is not about systems, it is not about indicators, it is all about money management and the battle inside your head.
Don't enter the war until you have properly equipped the army.
34 Tick Range Bar Chart (click on chart to view)

13 Tick Range Bar Chart
5/13/2008
Crude Oil, New Day, New High
The 34 tick range bar chart did another nice job of identifying the trending periods and the flat periods in the crude oil session today.
As we have stated before identifying the trending periods is not that difficult for most trading systems.
Identifying when not to trade is usually the harder call, and the most important call.
If you were only looking at the 13 tick chart you would have had many more trades and, I would suggest, far less profit.
The 2 lines on the 34 tick chart show when the trend started and when we can start looking for entries on the 13 tick range bar chart.
We wound up the day with 3 full stops, 1 break even, and 2 winning trades.
The key to success today and everyday is letting the winners run. We had one R12 winner and the other came back on us for a R1 win.
34 tick range bar chart (click on chart to view)

13 tick range bar chart

13 tick range bar chart
As we have stated before identifying the trending periods is not that difficult for most trading systems.
Identifying when not to trade is usually the harder call, and the most important call.
If you were only looking at the 13 tick chart you would have had many more trades and, I would suggest, far less profit.
The 2 lines on the 34 tick chart show when the trend started and when we can start looking for entries on the 13 tick range bar chart.
We wound up the day with 3 full stops, 1 break even, and 2 winning trades.
The key to success today and everyday is letting the winners run. We had one R12 winner and the other came back on us for a R1 win.
34 tick range bar chart (click on chart to view)

13 tick range bar chart

13 tick range bar chart
Subscribe to:
Posts (Atom)