I could adapt and then wait.
Showing posts with label crude oil renko chart. Show all posts
Showing posts with label crude oil renko chart. Show all posts
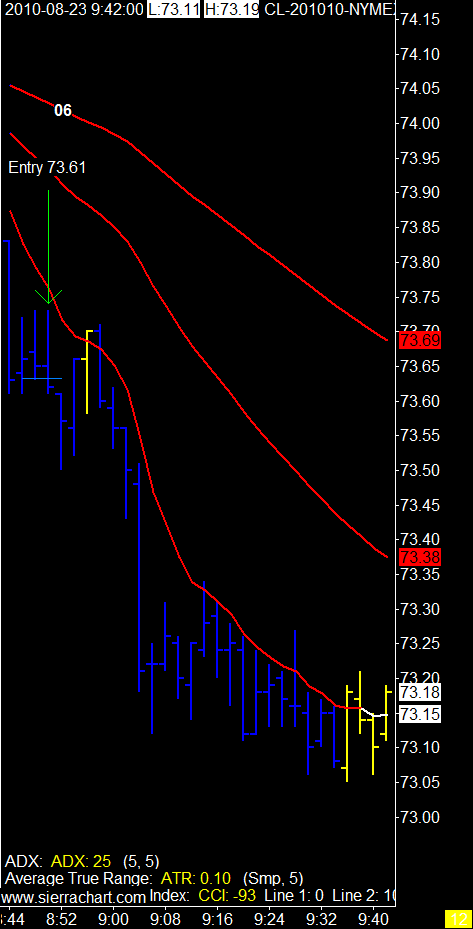
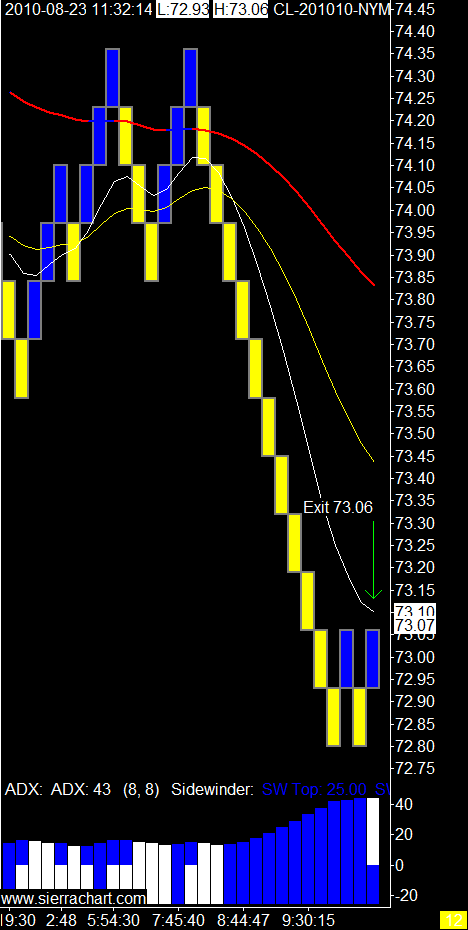
8/23/2010
9/16/2008
Crude Oil Continues Decline
Jessica Rinaldi/Reuters
The Exxon Mobil refinery in Baytown, Tex., the nation’s largest, escaped Hurricane Ike with limited damage, but its sister refinery in Beaumont was flooded by the storm surge.

"Crude oil prices fell to $91.39 a barrel in early trading on Tuesday, after closing under the symbolic $100-a-barrel threshold on Monday." Jad Mouawad, NY Times
Click on the read more icon for the full NY Times story.
read more digg story
8 Tick Crude Oil Renko Chart
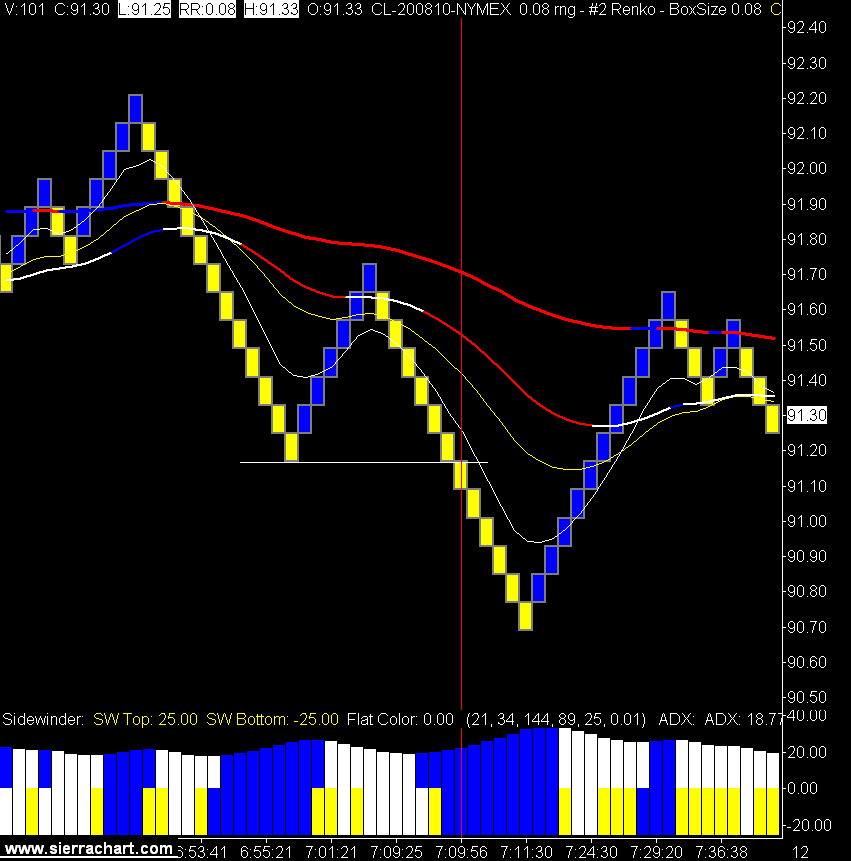
The Exxon Mobil refinery in Baytown, Tex., the nation’s largest, escaped Hurricane Ike with limited damage, but its sister refinery in Beaumont was flooded by the storm surge.

"Crude oil prices fell to $91.39 a barrel in early trading on Tuesday, after closing under the symbolic $100-a-barrel threshold on Monday." Jad Mouawad, NY Times
Click on the read more icon for the full NY Times story.
read more digg story
8 Tick Crude Oil Renko Chart

8/19/2008
Renko Rides Trend to the End
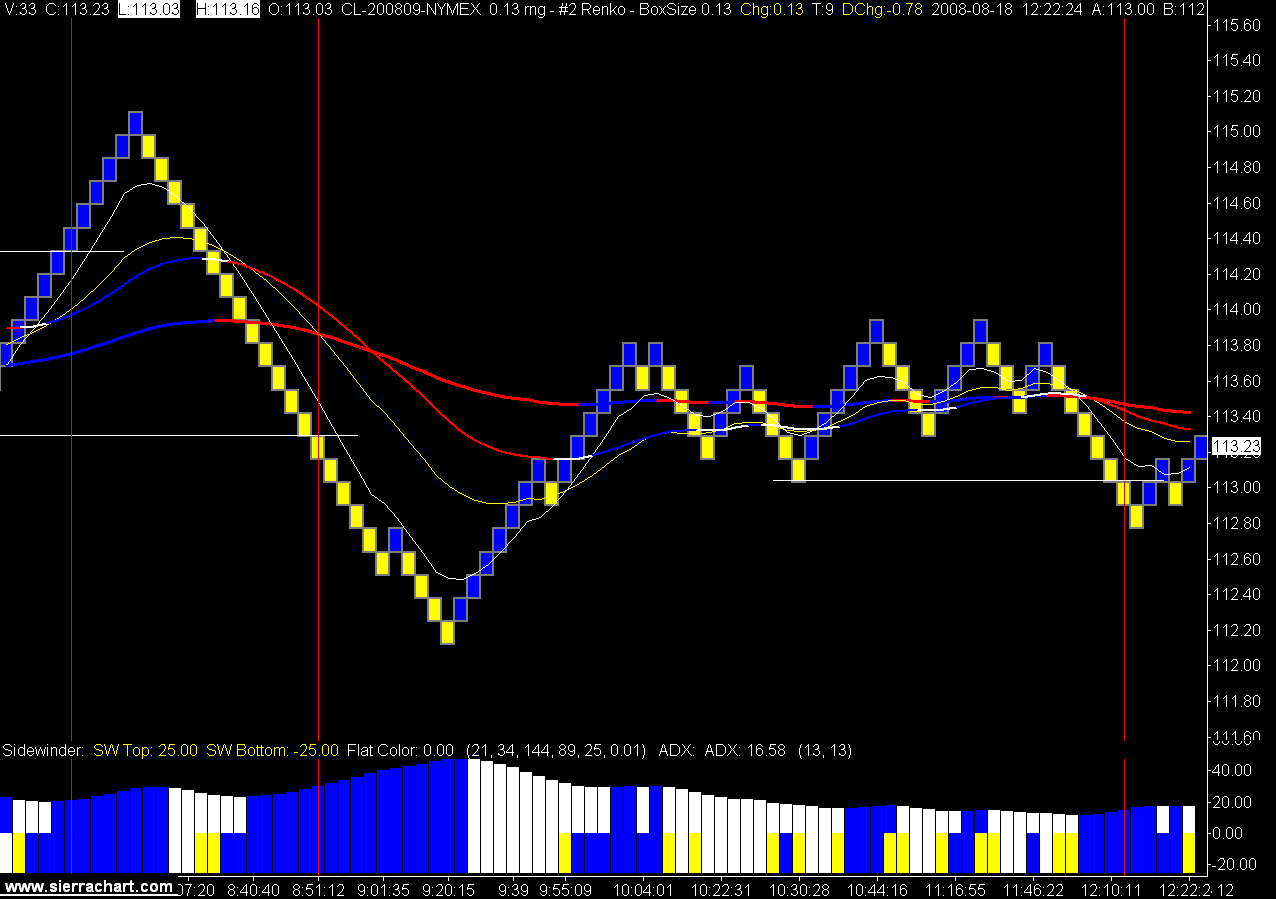
The day started out very slow and I got a little anxious and took a trade before the EMAs were all on the right side of each other. Fortunately I got a break even on that one and then next one exploded to the upside.
The Renko bars called the top of trade and I got out with the ADX color change.
Nice day to trade crude oil.
13 Tick Renko Crude Oil Chart (click to view)

The Renko bars called the top of trade and I got out with the ADX color change.
Nice day to trade crude oil.
13 Tick Renko Crude Oil Chart (click to view)

8/18/2008
Trading Fear Without Greed
8/12/2008
Trading the Plan, Even if it Hurts
Only 2 signals today, which is a good thing as I would rather trade less than more.
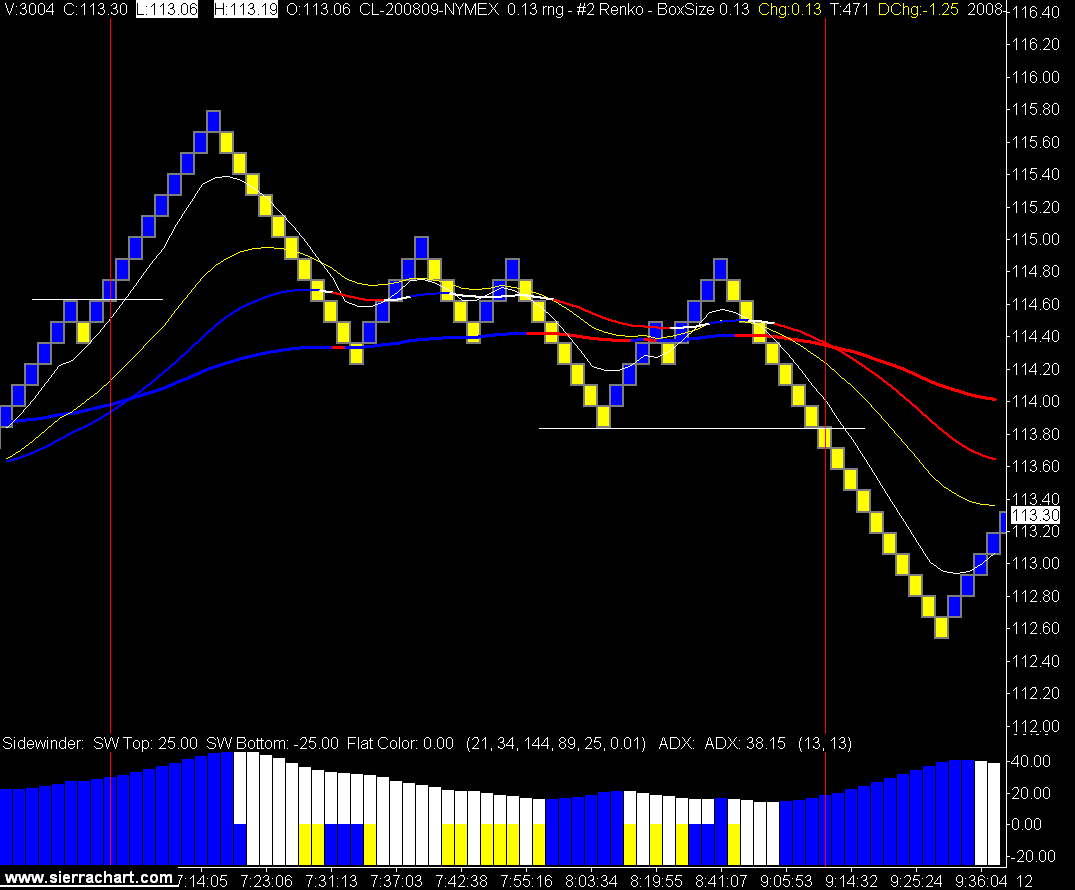
Both signals were clear, both signals had nice follow through, and I lost money on both signals.
The 12 tick stops were not wide enough to keep me in and I do not try and re enter until that move is over. In other words I have to wait for a new signal. This rule is in place to keep me out of my revenge trading mode.
That's they way it is with trading, sometimes it's all there and you don't get anything but pain. Which is why people change their plan over and over. I will just show up for work tomorrow and do the same thing.
13 Tick Renko Bar Crude Oil Chart (click on chart to view)

Labels:
crude oil renko chart,
renko bars,
trade the plan
8/07/2008
Crude Oil Renko Chart
I have been looking at Renko charts for the past couple of days and traded it live today for the first time.
Thanks to J the FX wizard for the heads up on Renko charts.
There doesn't seem to be alot of info on the web about Renko charts so if you have anything to offer please post your comments.
This is the Investopedia information.
A type of chart, developed by the Japanese, that is only concerned with price movement; time and volume are not included. It is thought to be named for the Japanese word for bricks, "renga". A renko chart is constructed by placing a brick in the next column once the price surpasses the top or bottom of the previous brick by a predefined amount. This type of chart is very effective for traders to identify key support/resistance levels. Transaction signals are generated when the direction of the trend changes and the bricks alternate colors.
I have been using range bars for my entry chart and the renko bars are just a different type of range bar. The key being they have to move past the previous bar by the set number of ticks you choose, not just oscillate in that range.
We shall see how things go from here but I like what I see so far.
Only 2 signals today as I waited for a previous low to be taken out before entering.
One winner and one loser and a nice demonstration of let your winners run and cut your losers quick. The daily reward / risk ratio was 7.76.
13 Tick Renko Range Bar Chart (click on chart to view)

Subscribe to:
Posts (Atom)
