To take them all or to not take them all?
This was the question of the day in the trading room the other day. I seemed to be standing alone with my premise that I do not take them all. After two full stops I quit for the day, or at least go sim for the rest of the day. This caused much abuse to be heaped upon me from the take all signal boys.
Well taking all signals sounds good and in theory I'm all for it. However I don't trade theory I trade money and my experience has been that my trading goes significantly downhill as the consecutive losses stack up. So, for me, I have found it beneficial to stop at 2 full stops.
Beside my personal trading issues I also think that stopping for the day runs along the lines of cutting your losers and letting your winners run. Ok I admit that's a bit of a stretch. Yes I also used to quit after 2 full targets hit in the day. That was a stupid idea, why didn't you speak up.
All professional traders have risk management limits that they must live under. My question for the take all signal boys is, at what point do you quit? Never? You would just keep taking loser after loser, and this has no affect on your execution?
I doubt it.
With my system I need momentum to keep moving, and there are days where you get just enough to produce a signal and then it reverses. Sometimes this happens over and over all day. Do some days just find that range and stay in it? The answer as always in trading is sometimes.
Now the take all signal boys want my stats to prove that this is a financially sound idea. I must admit I don't have them. After quitting or going to sim my record keeping had been going out the door with my interest level. This was a mistake on my behalf, and that mistake has been rectified.
I am now keeping all live and sim stats along with another technical setup that I want to see the results from.
We shall see.
Today was all live as I had 1 full target, 1 full stop, and 3 bes.
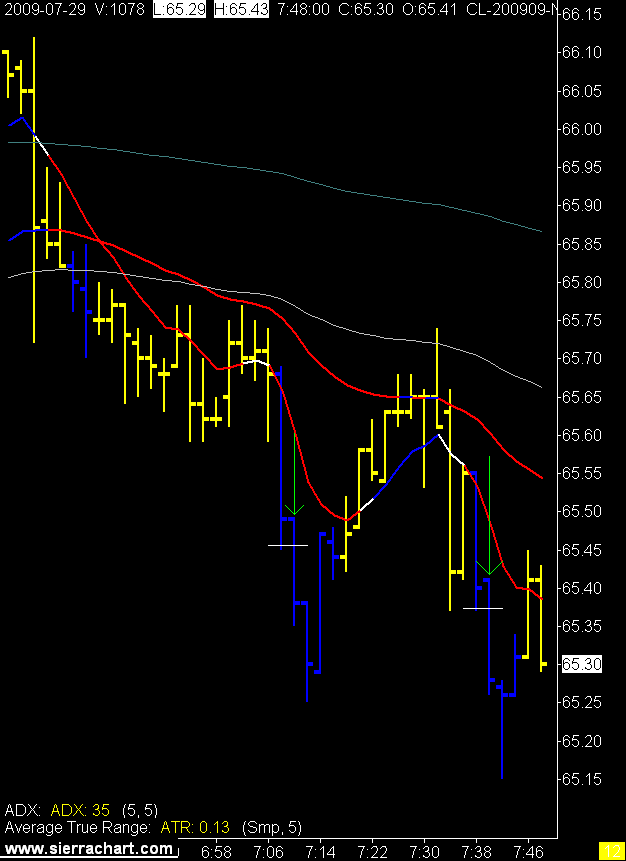
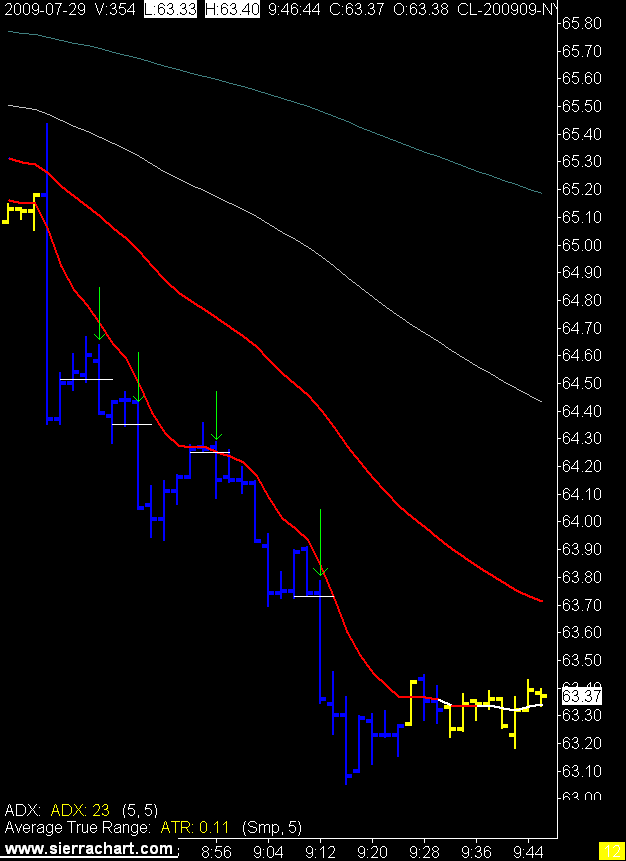
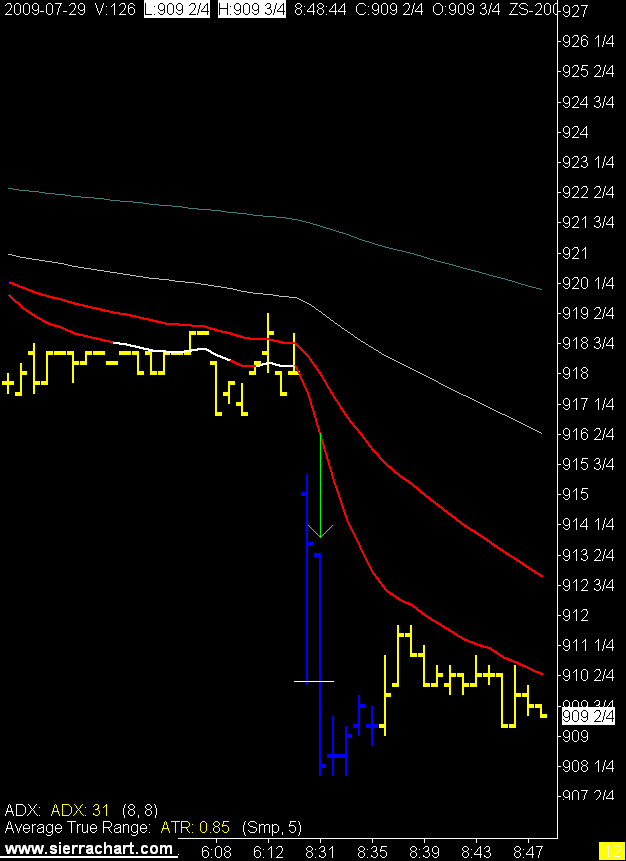
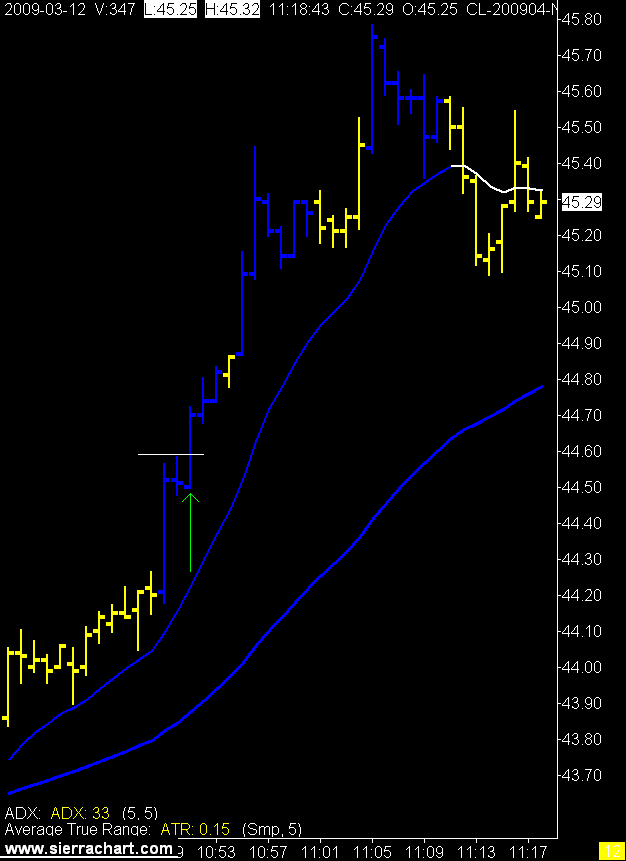
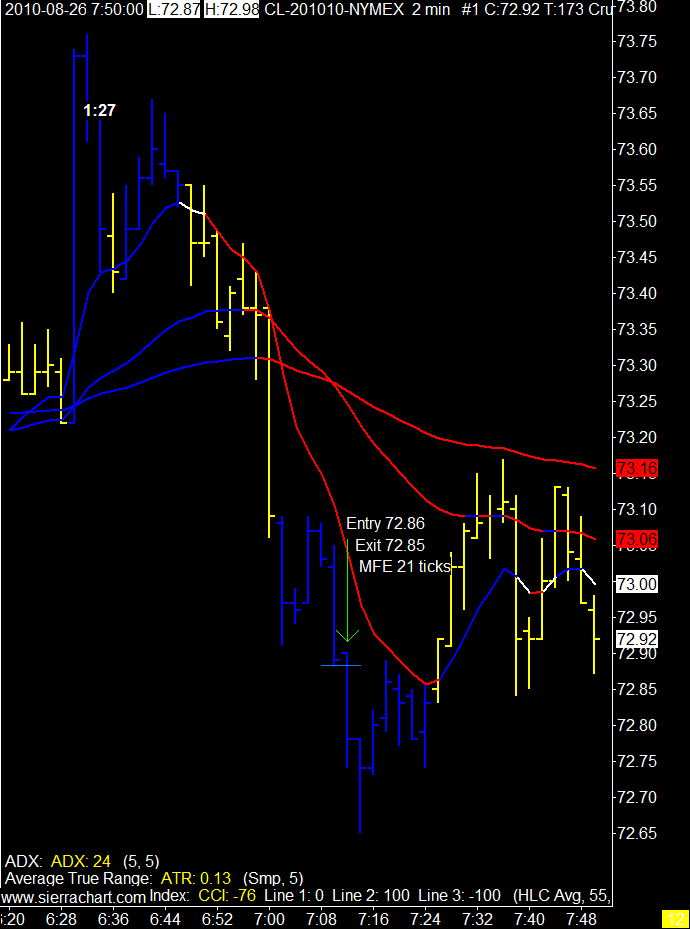
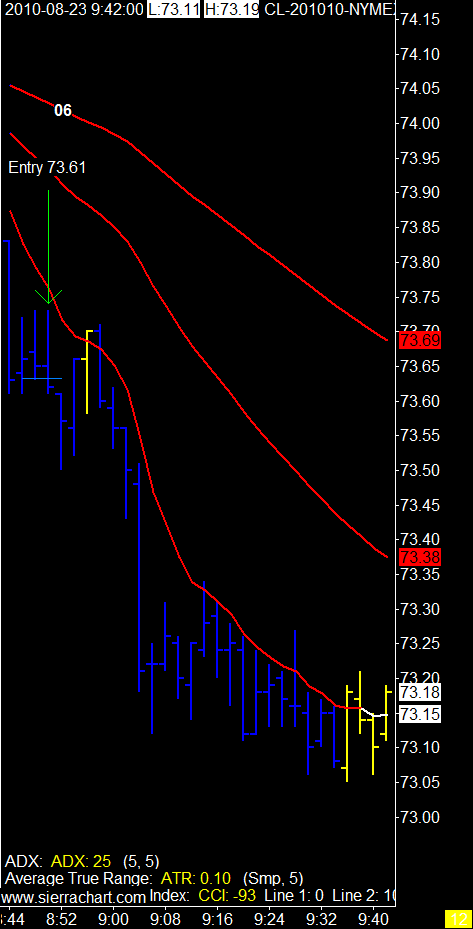
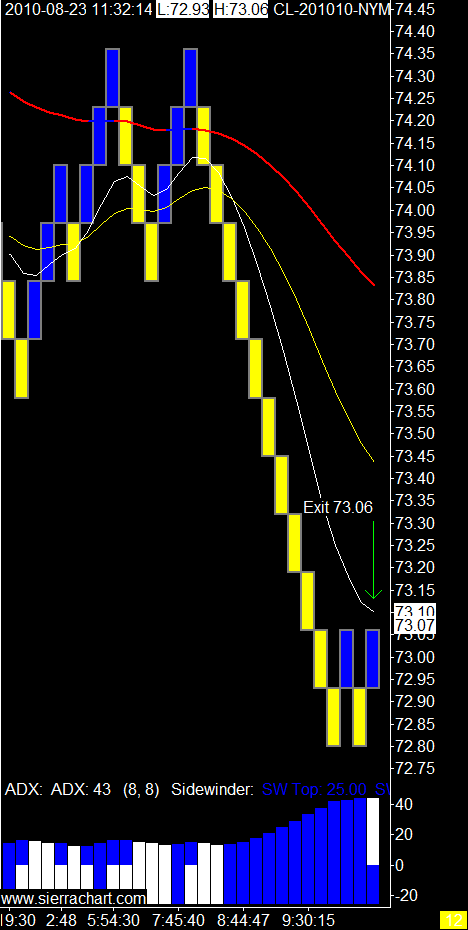
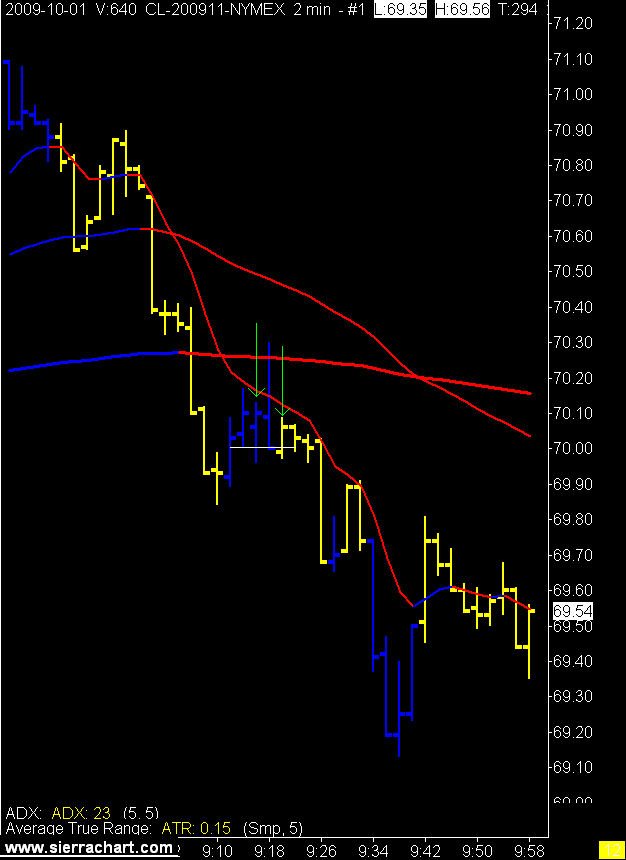
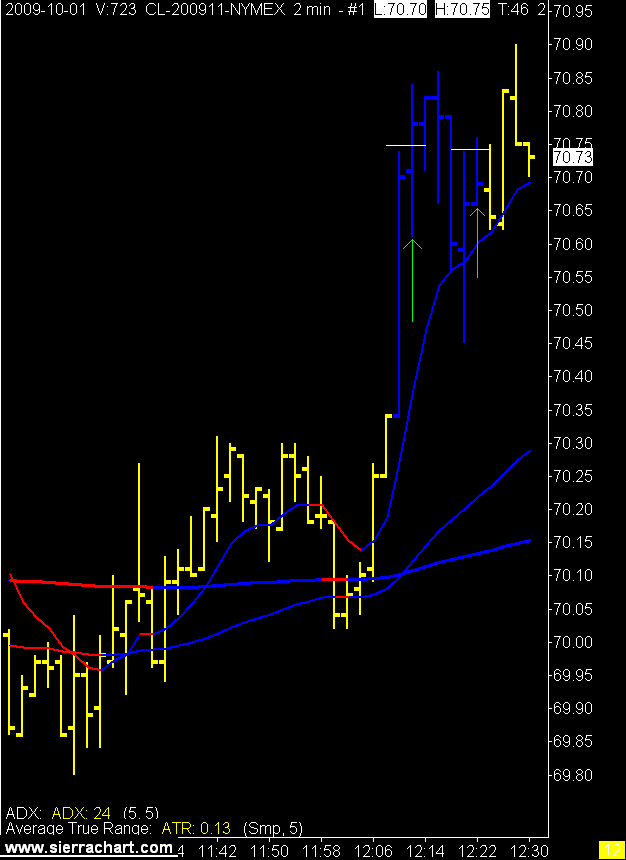
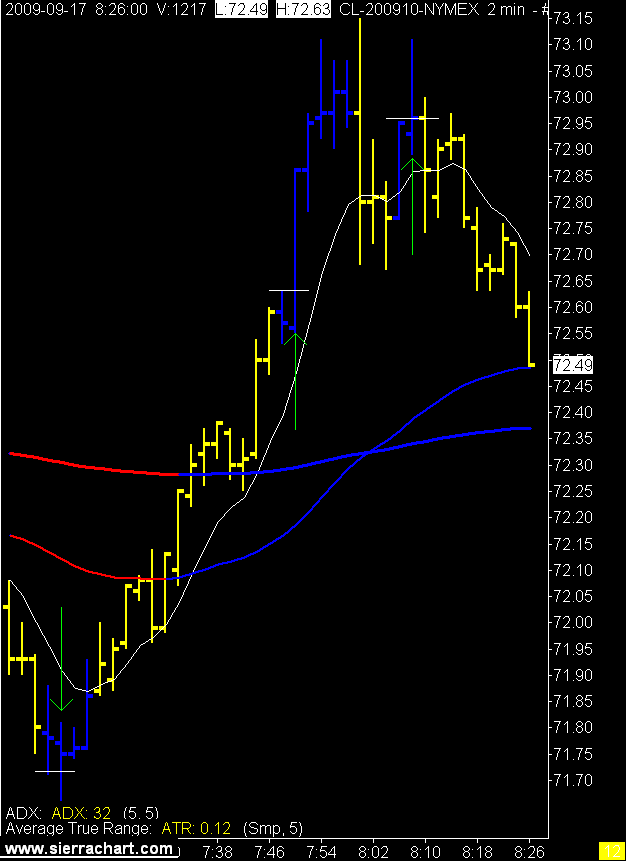
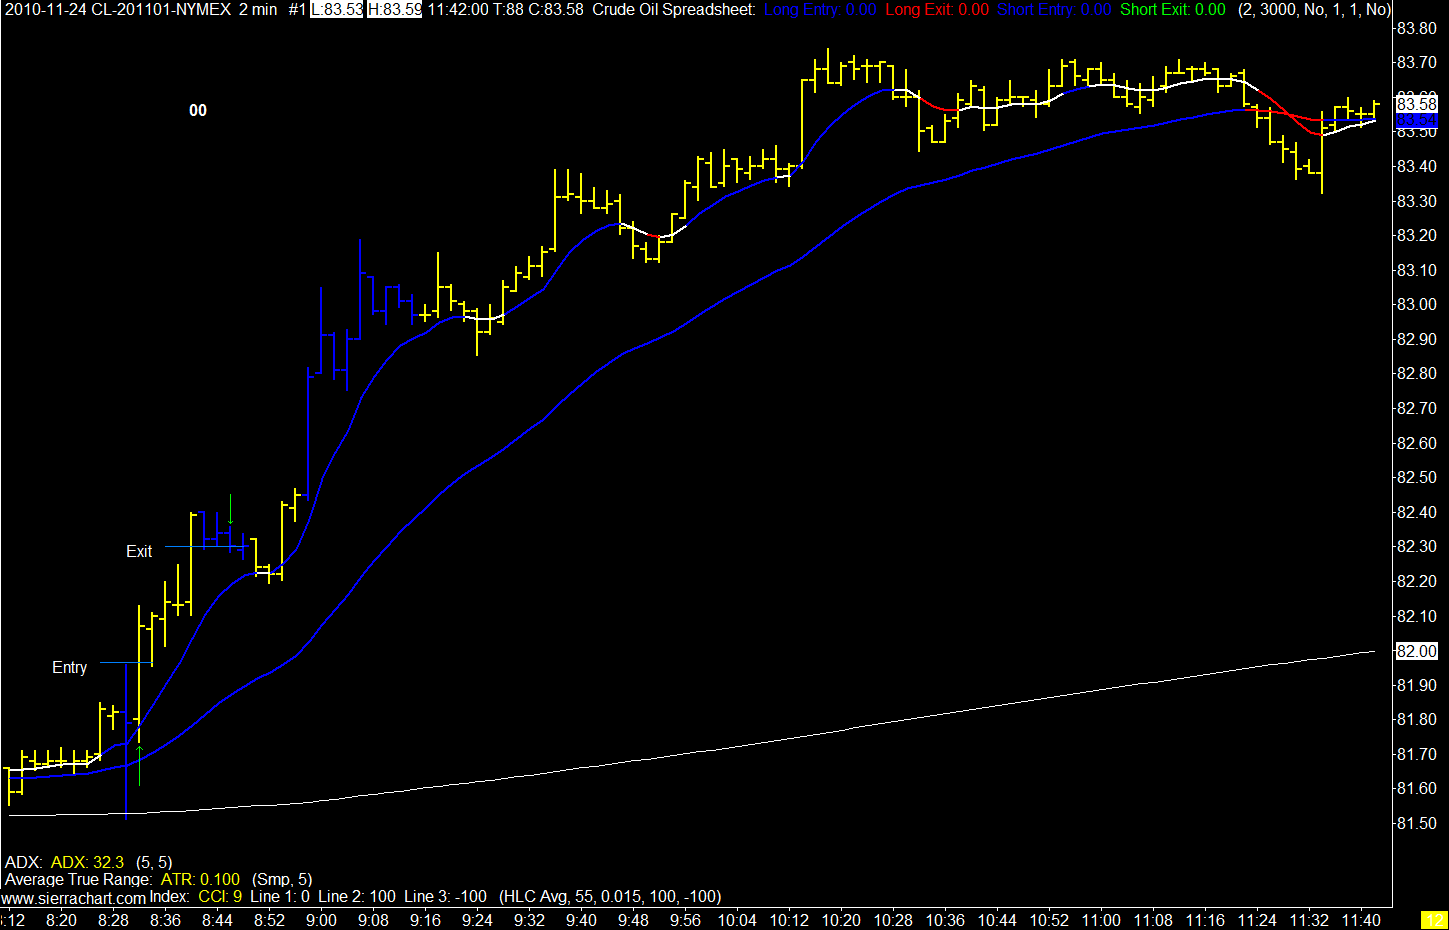
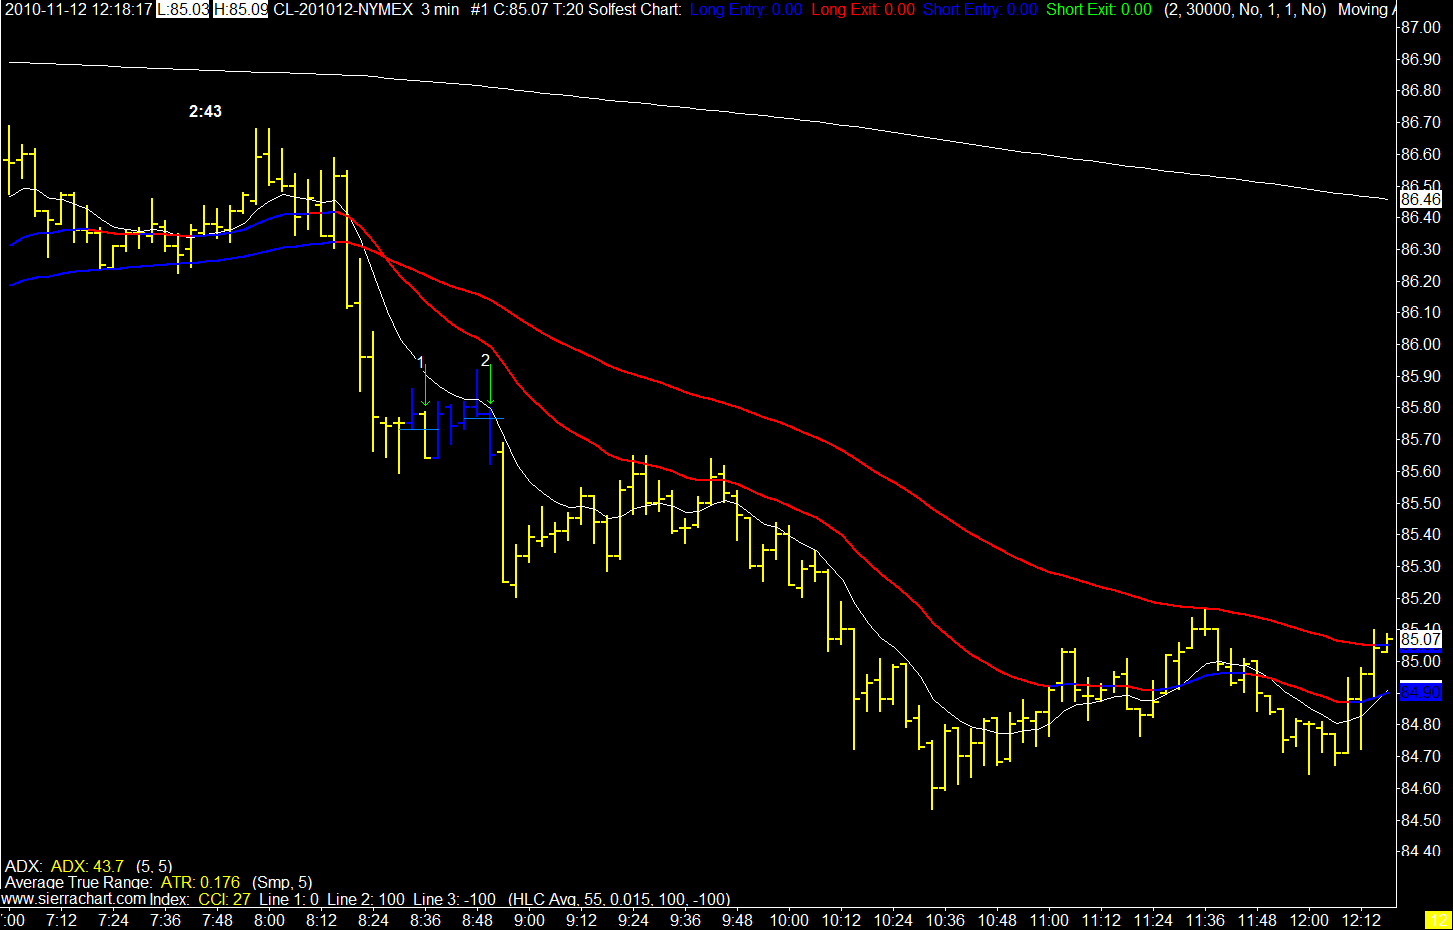
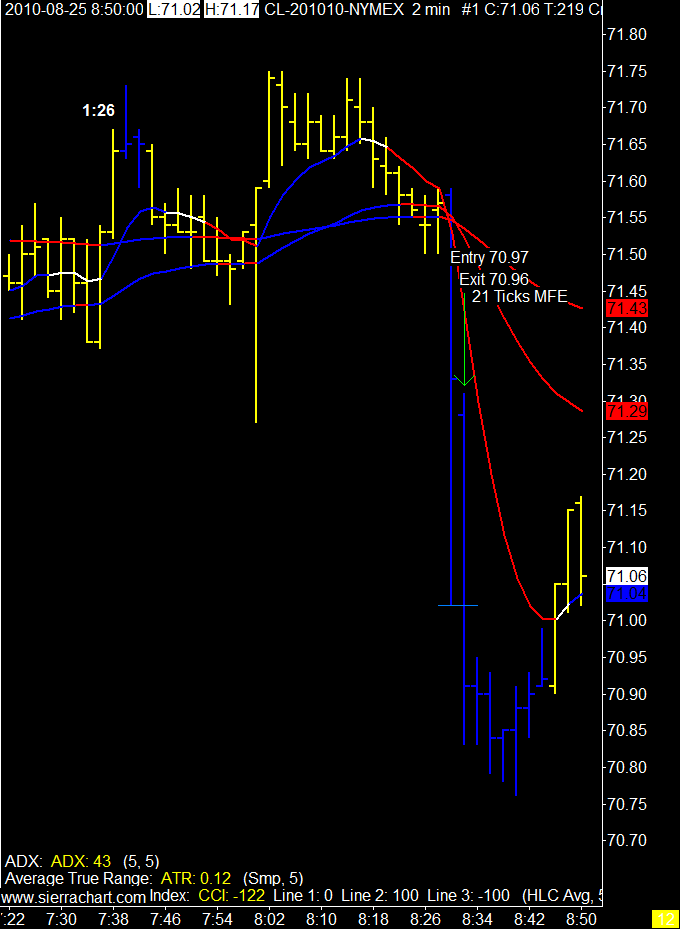
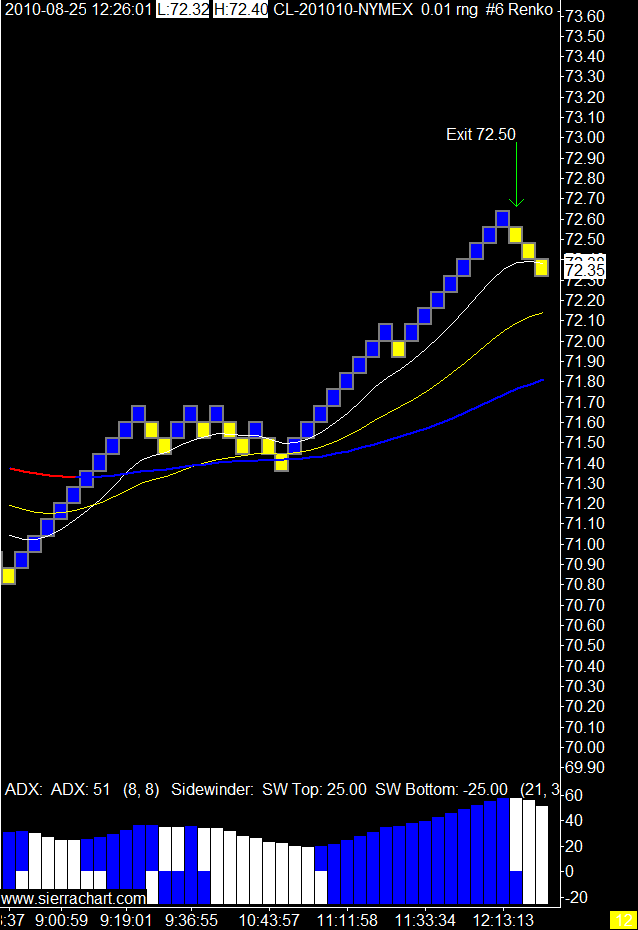
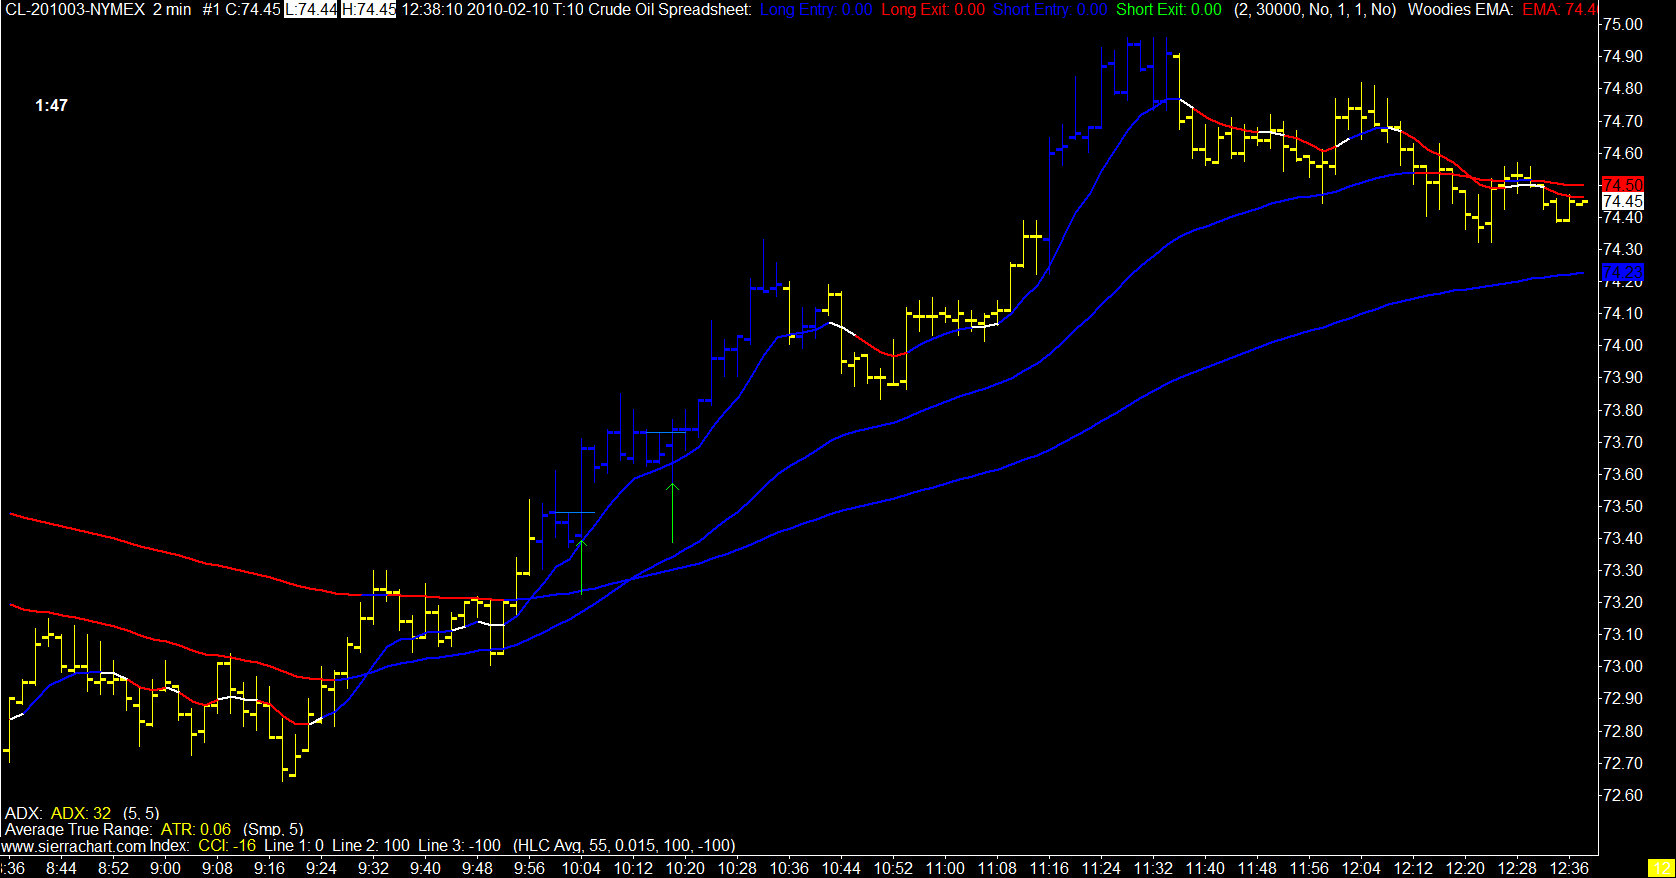
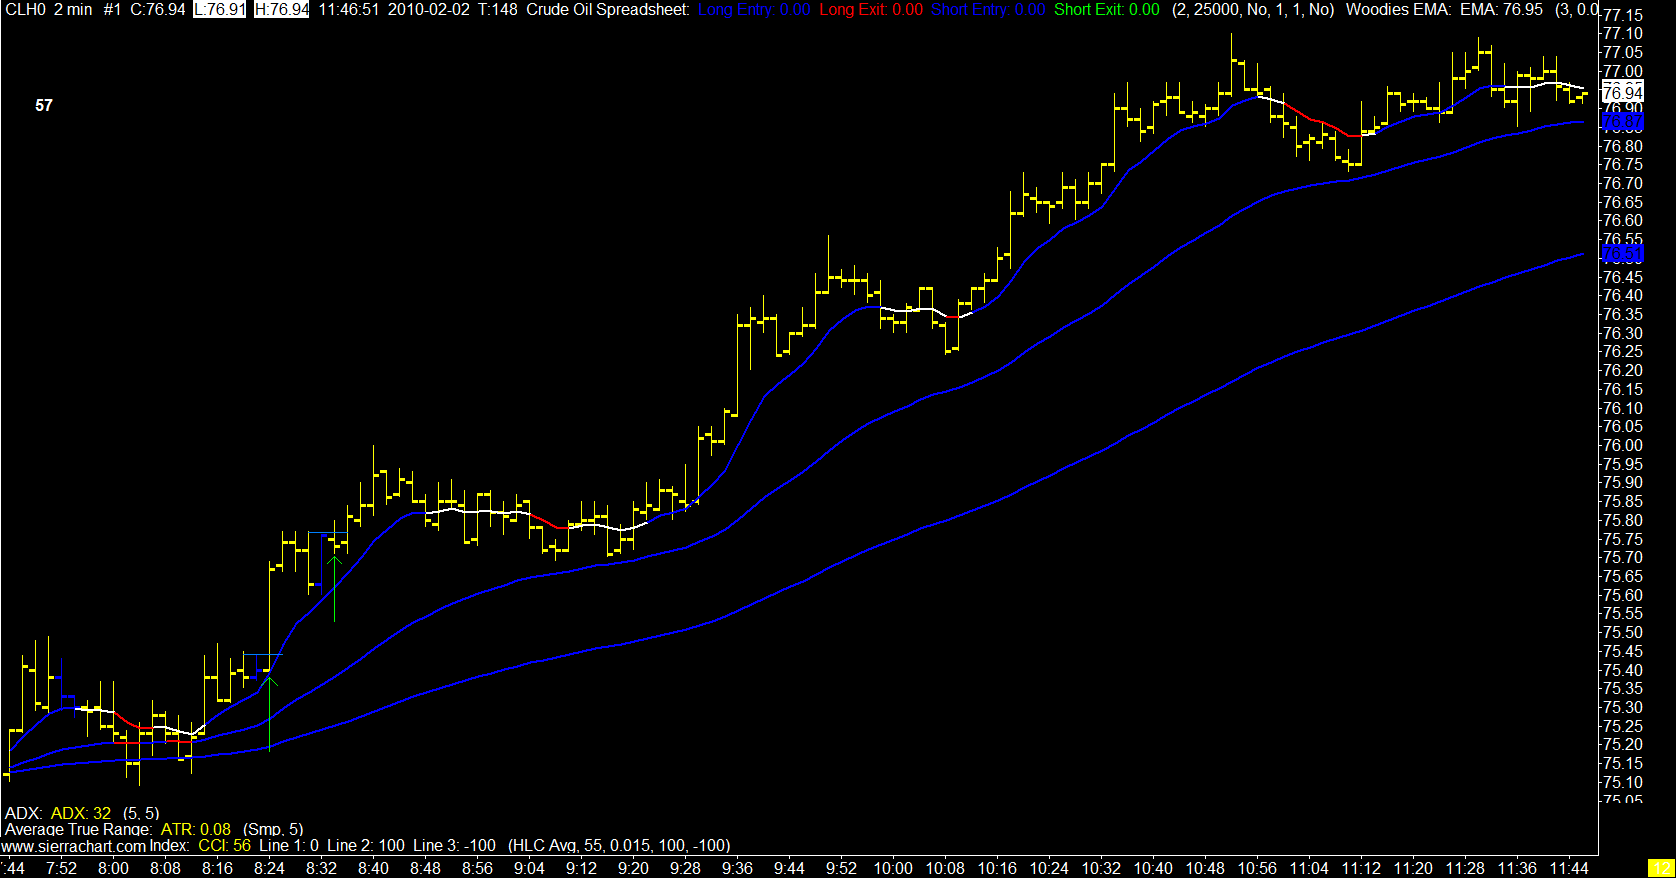
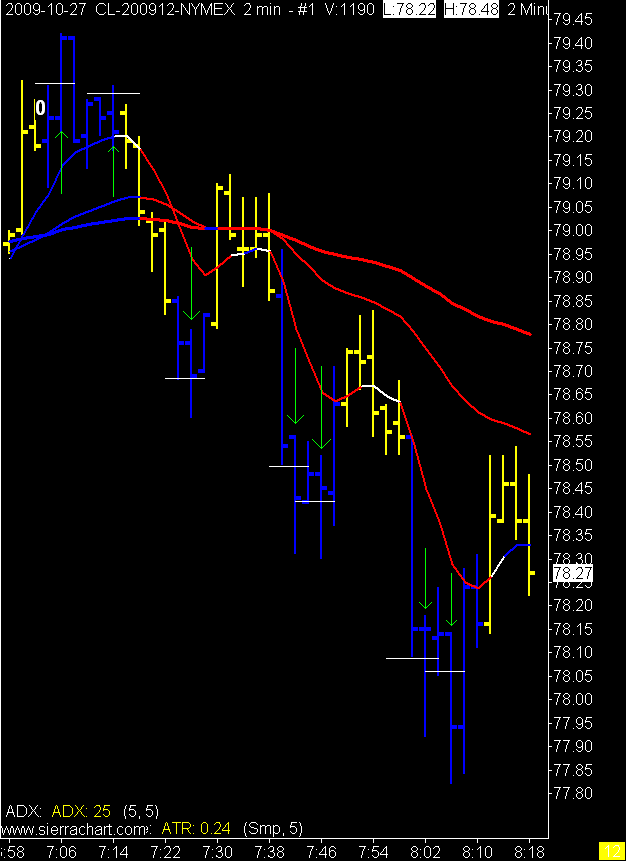
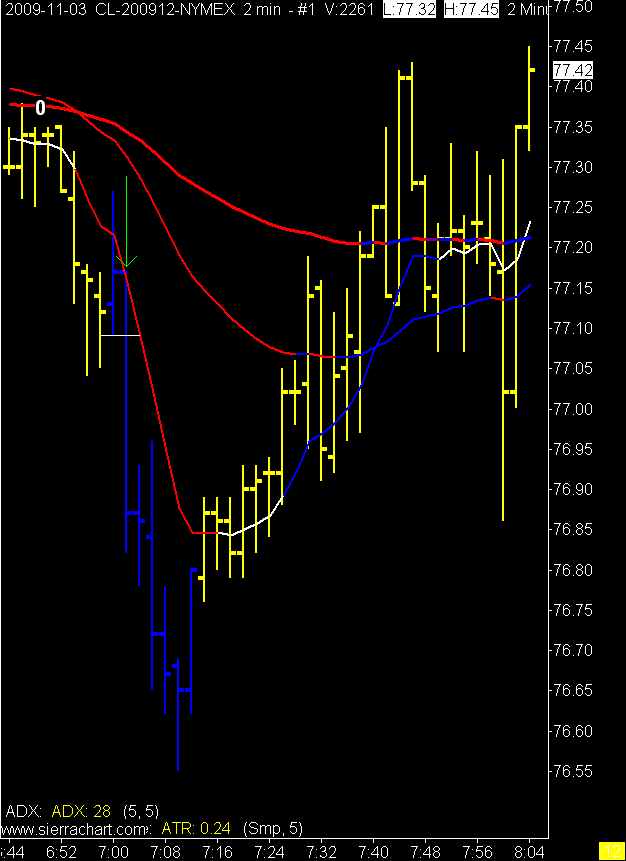
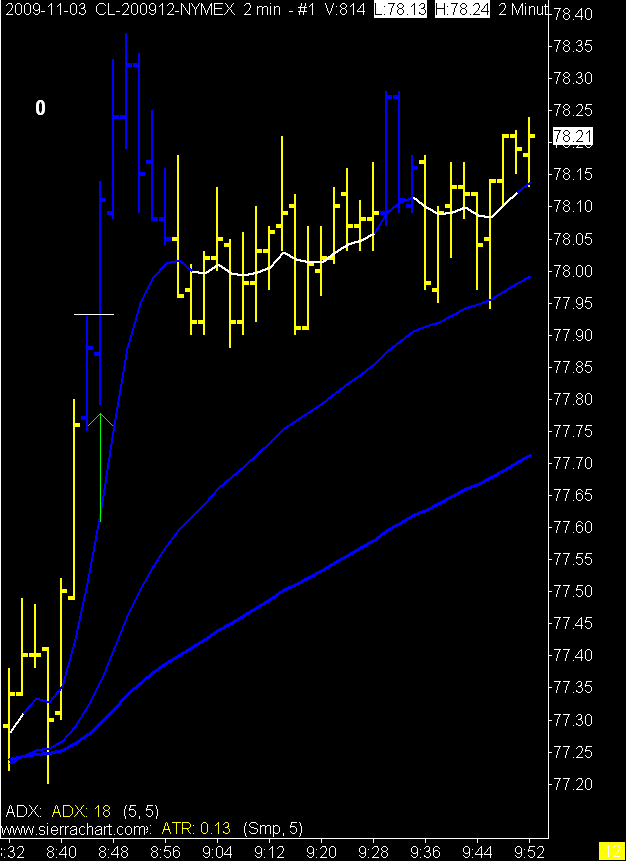
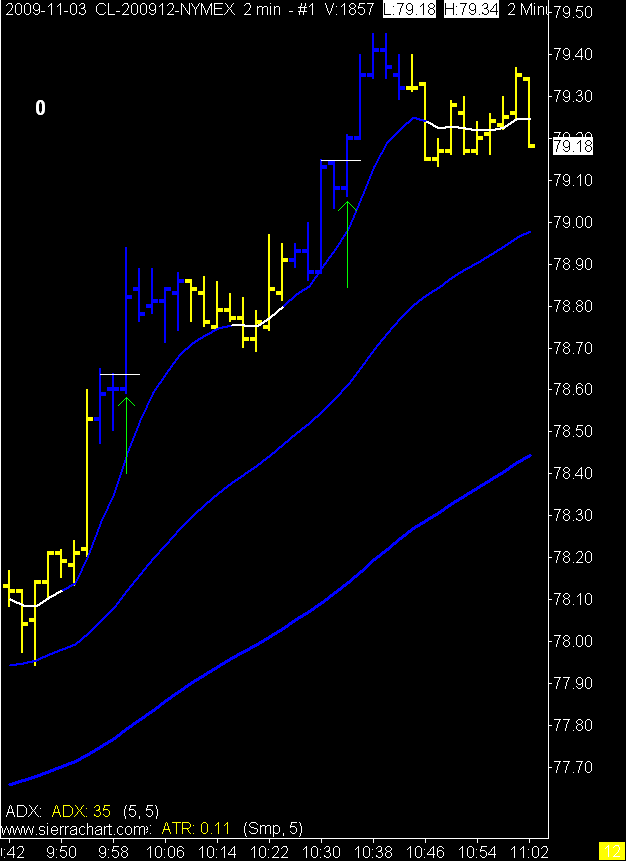
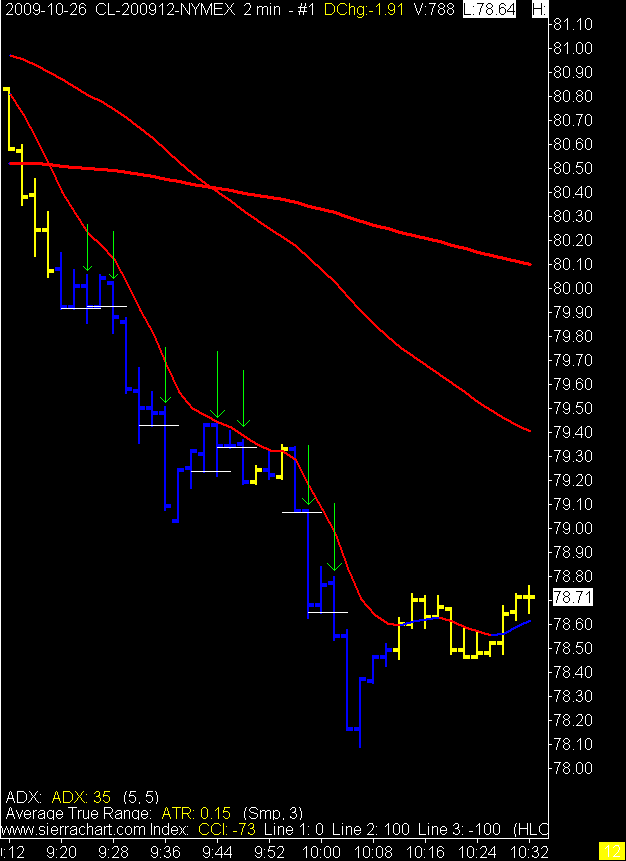
2 Minute Crude Oil Charts

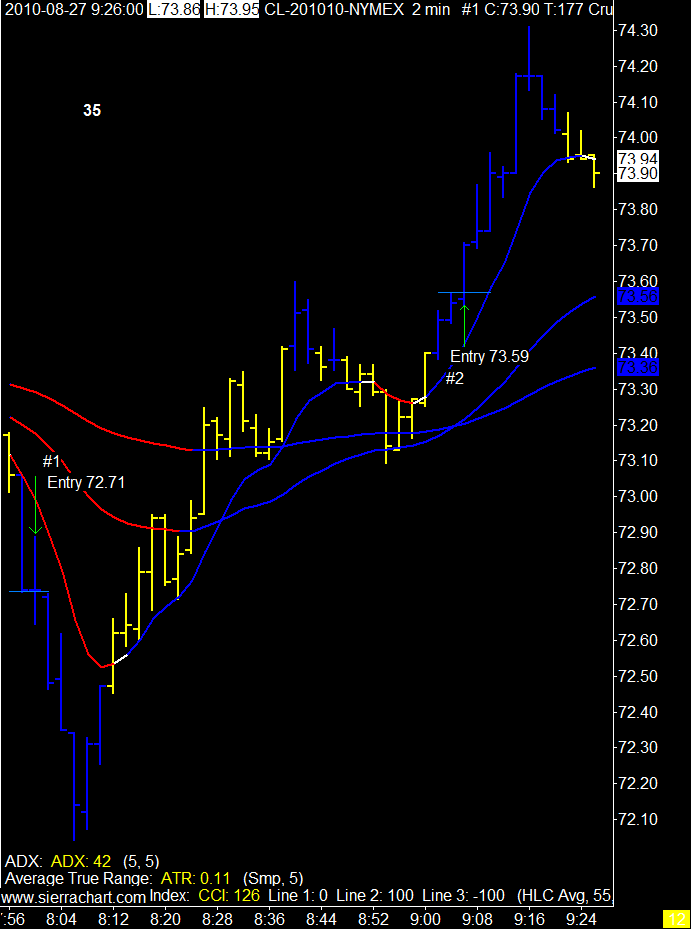
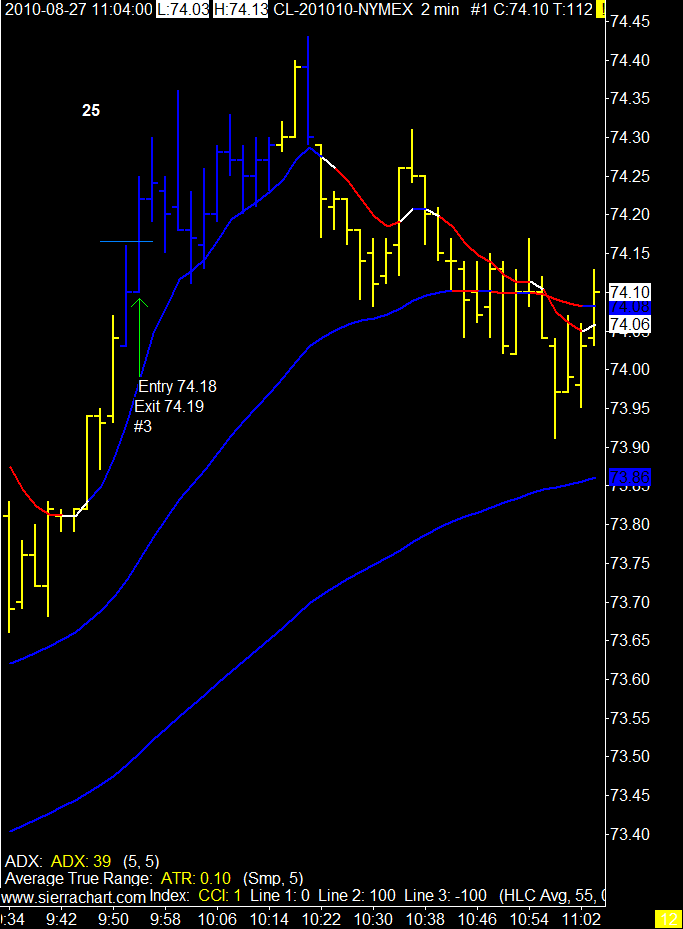
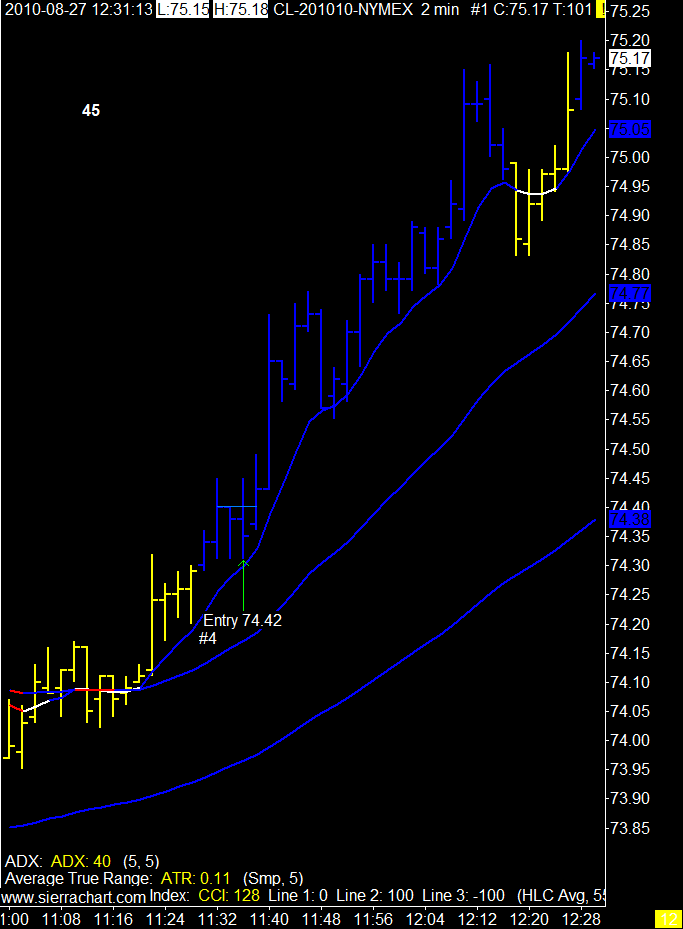
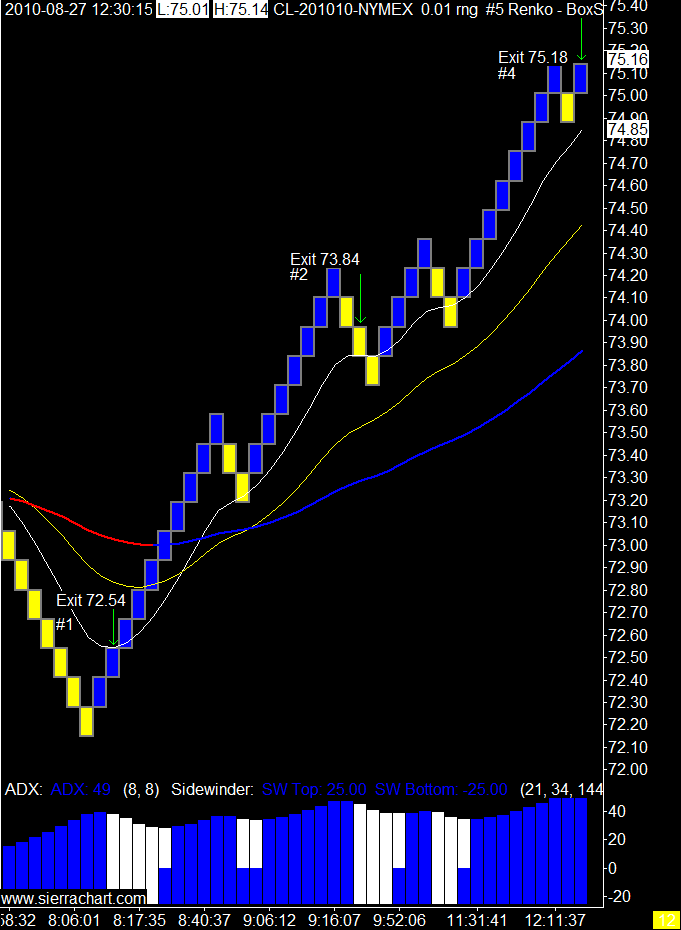

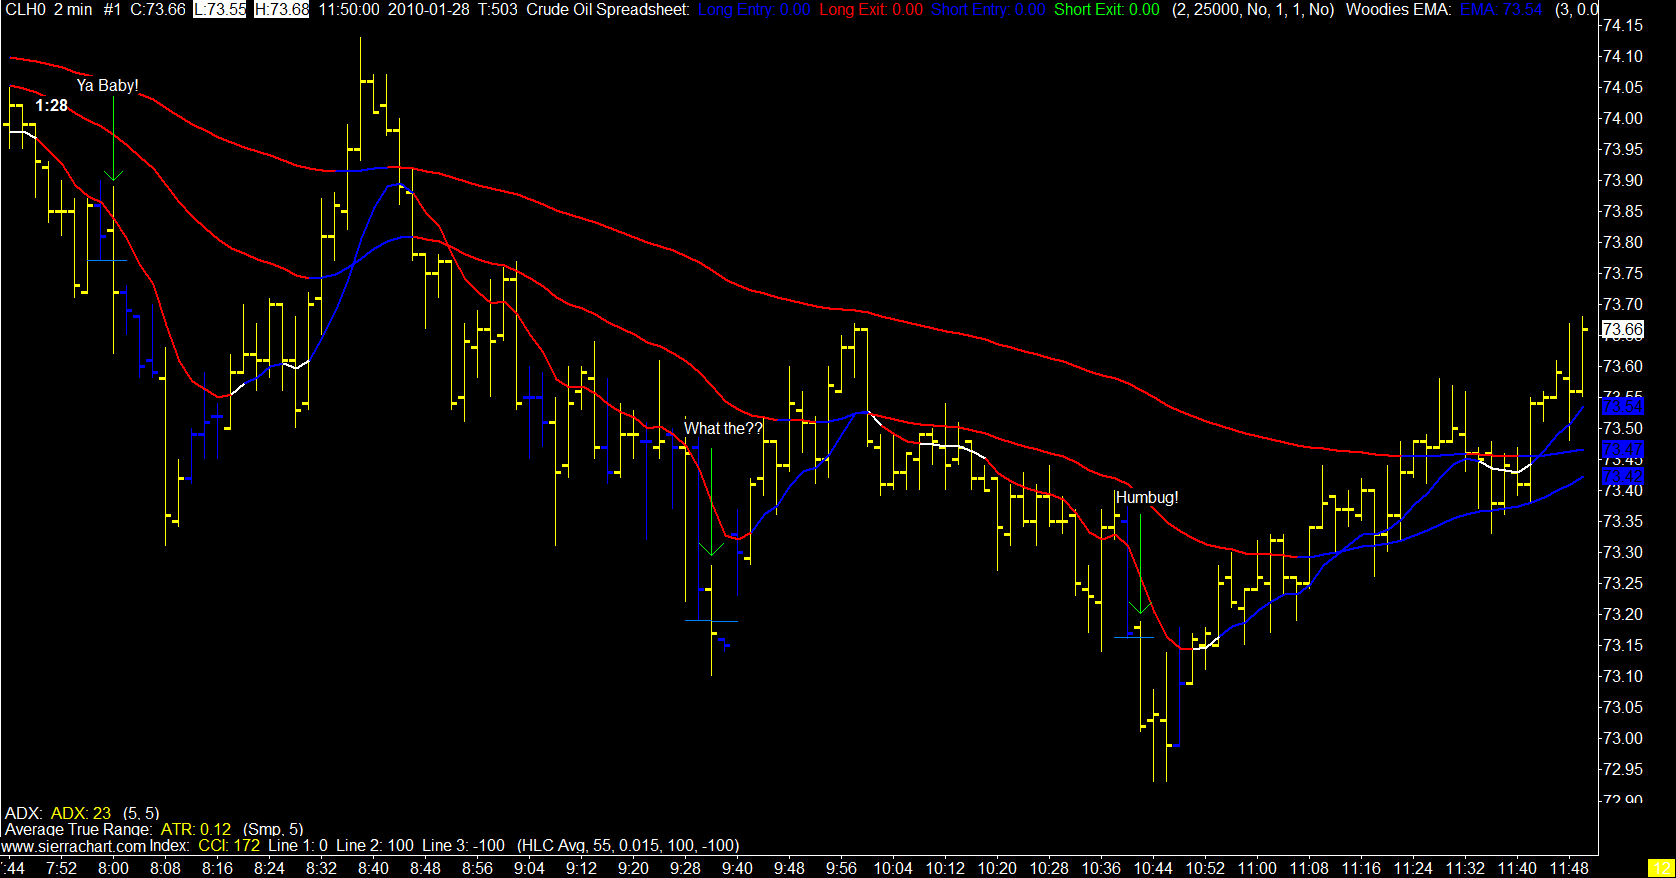
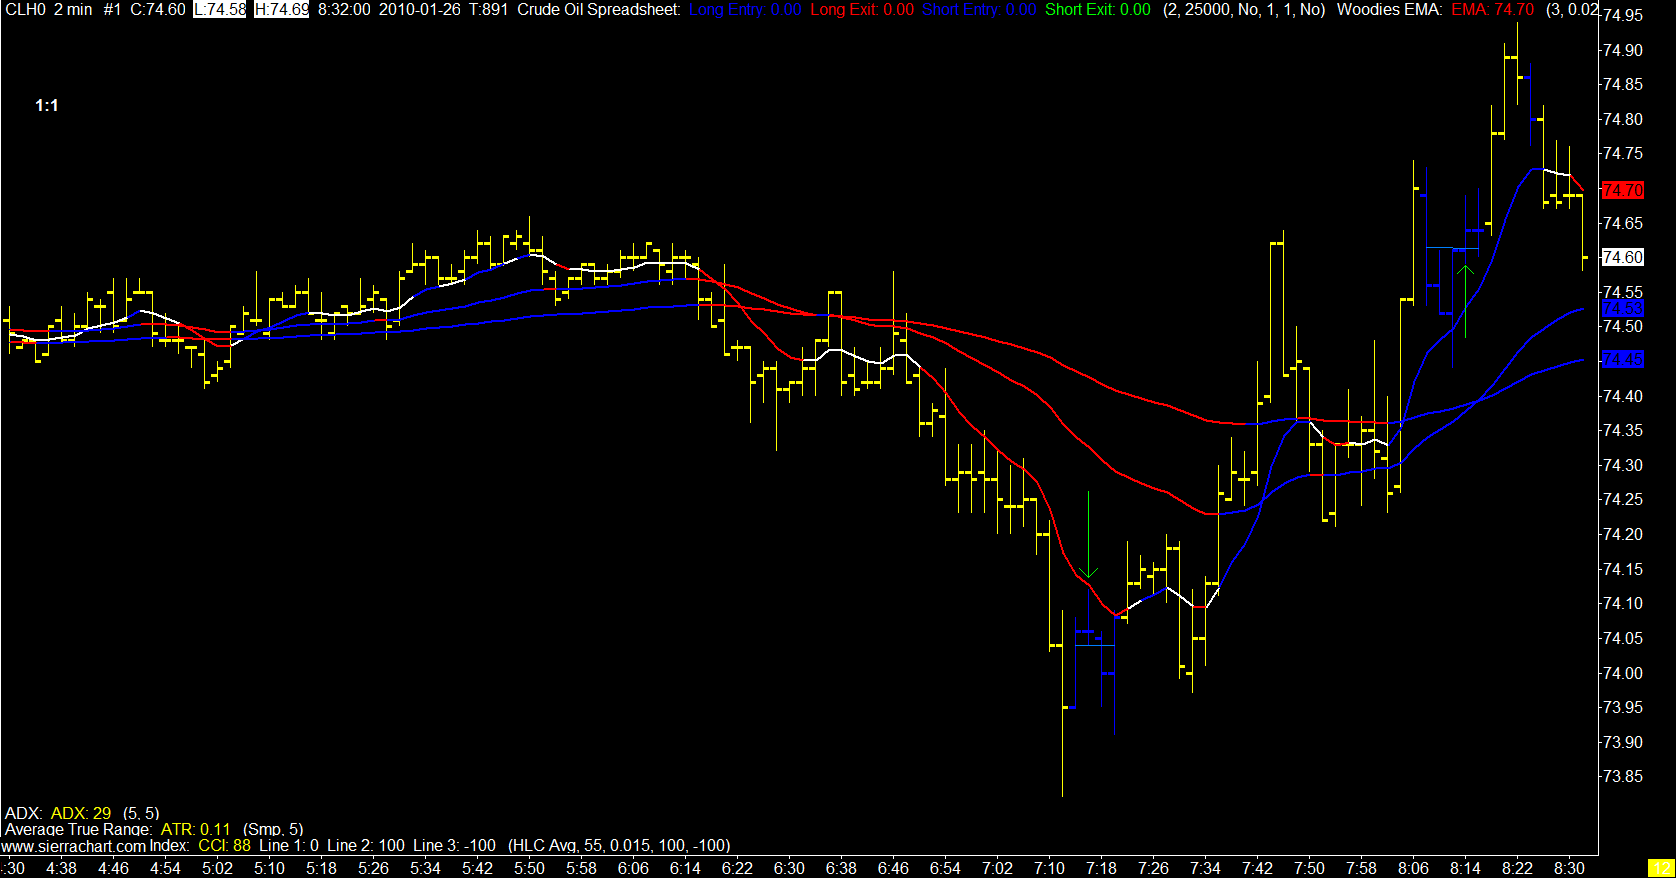
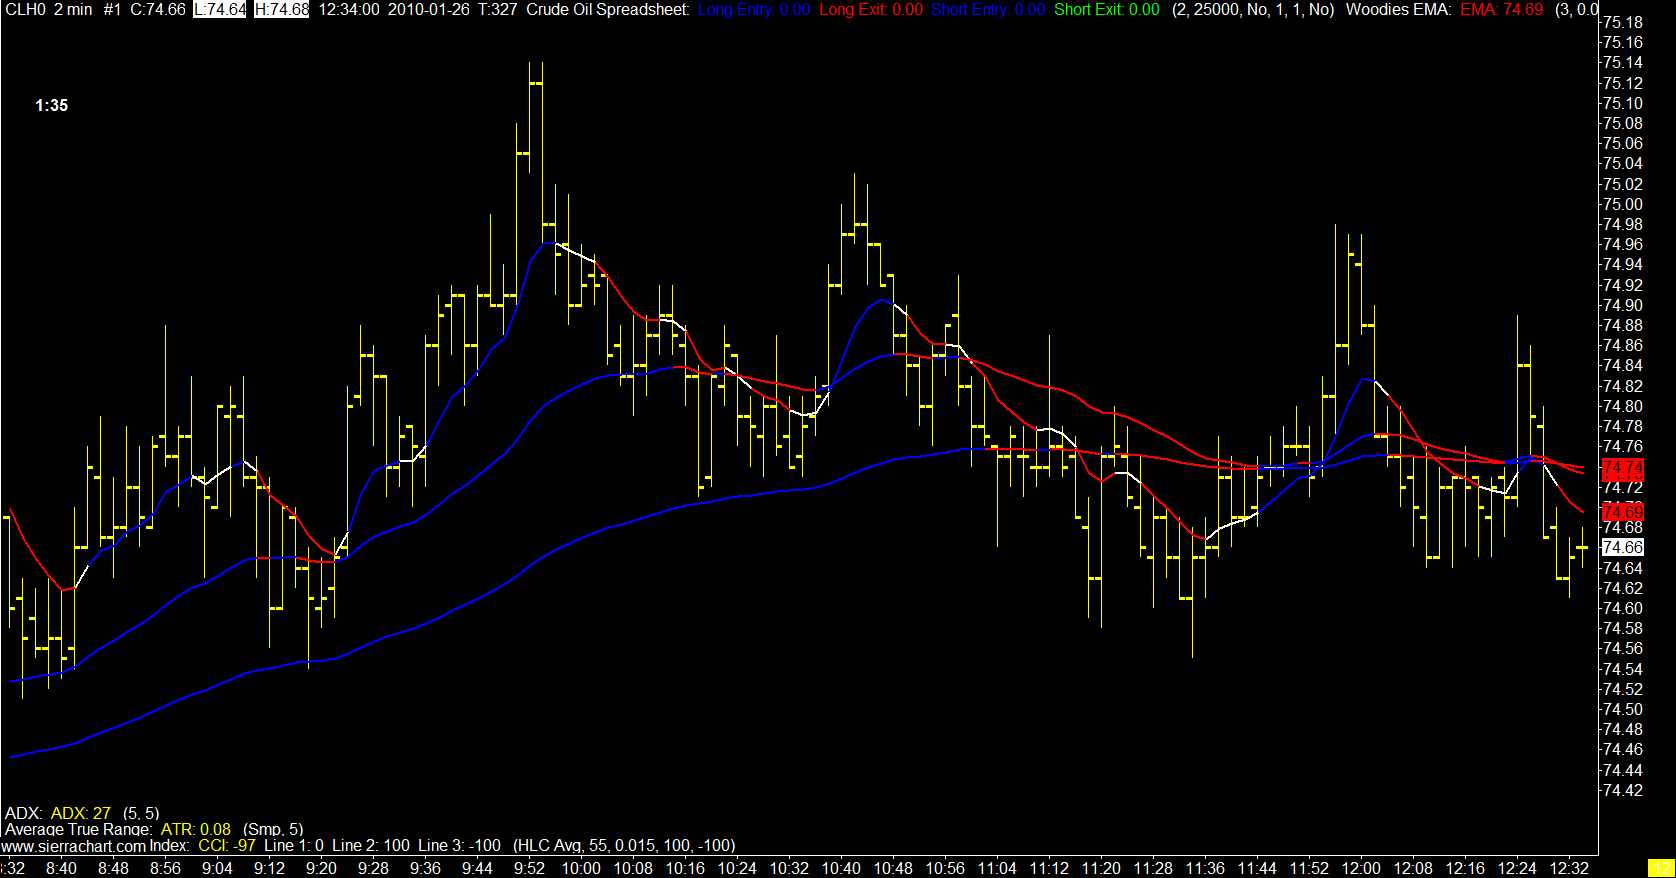
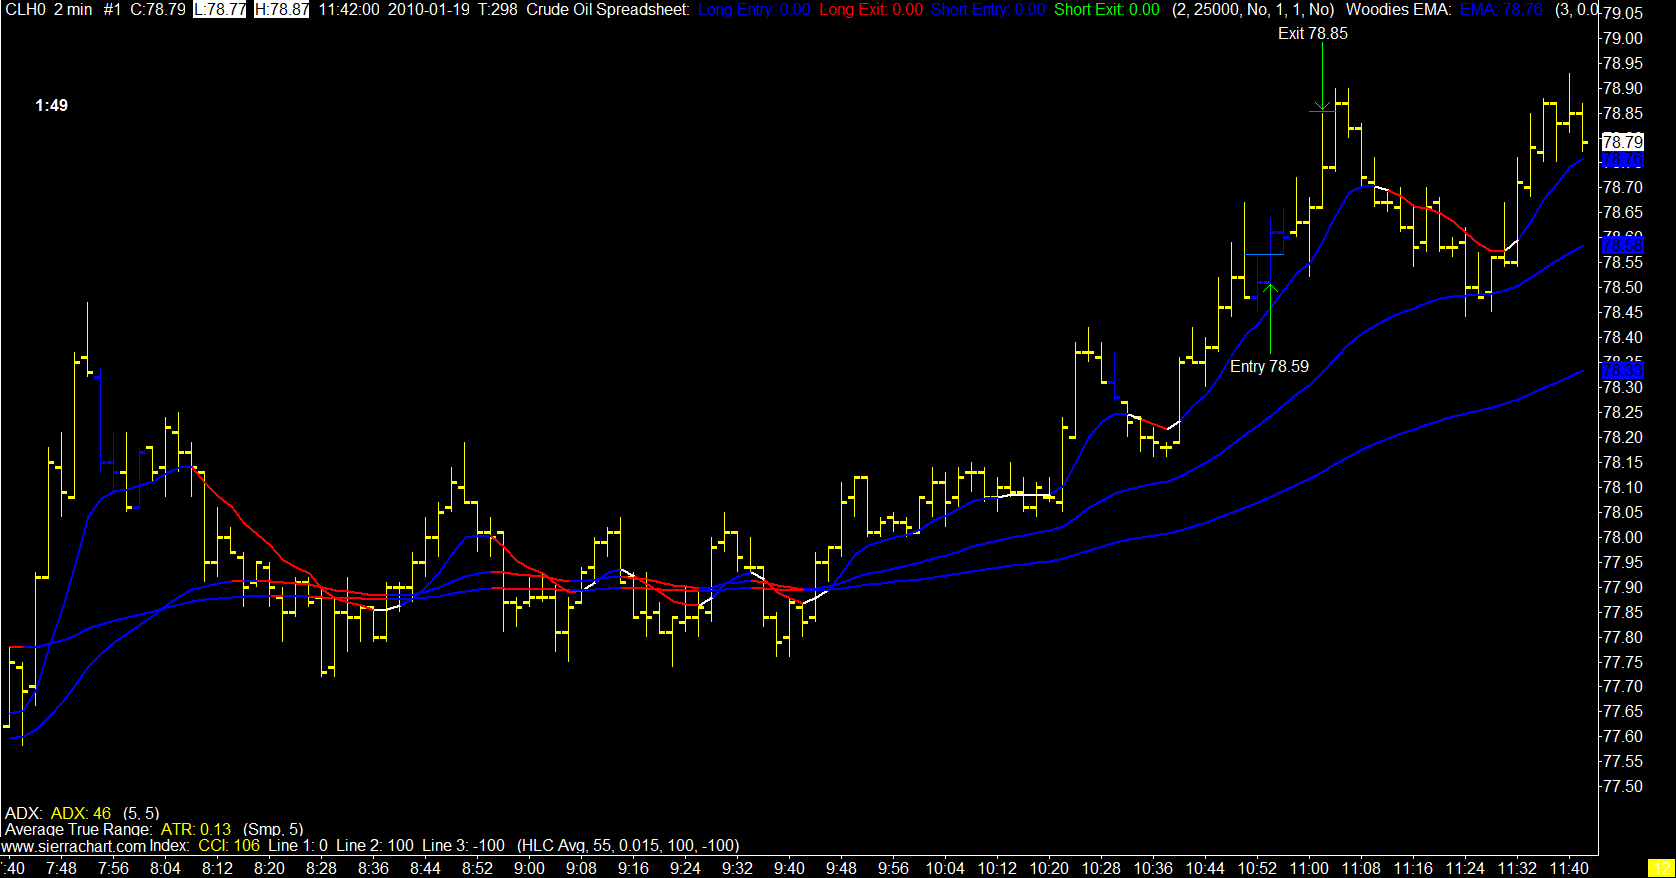
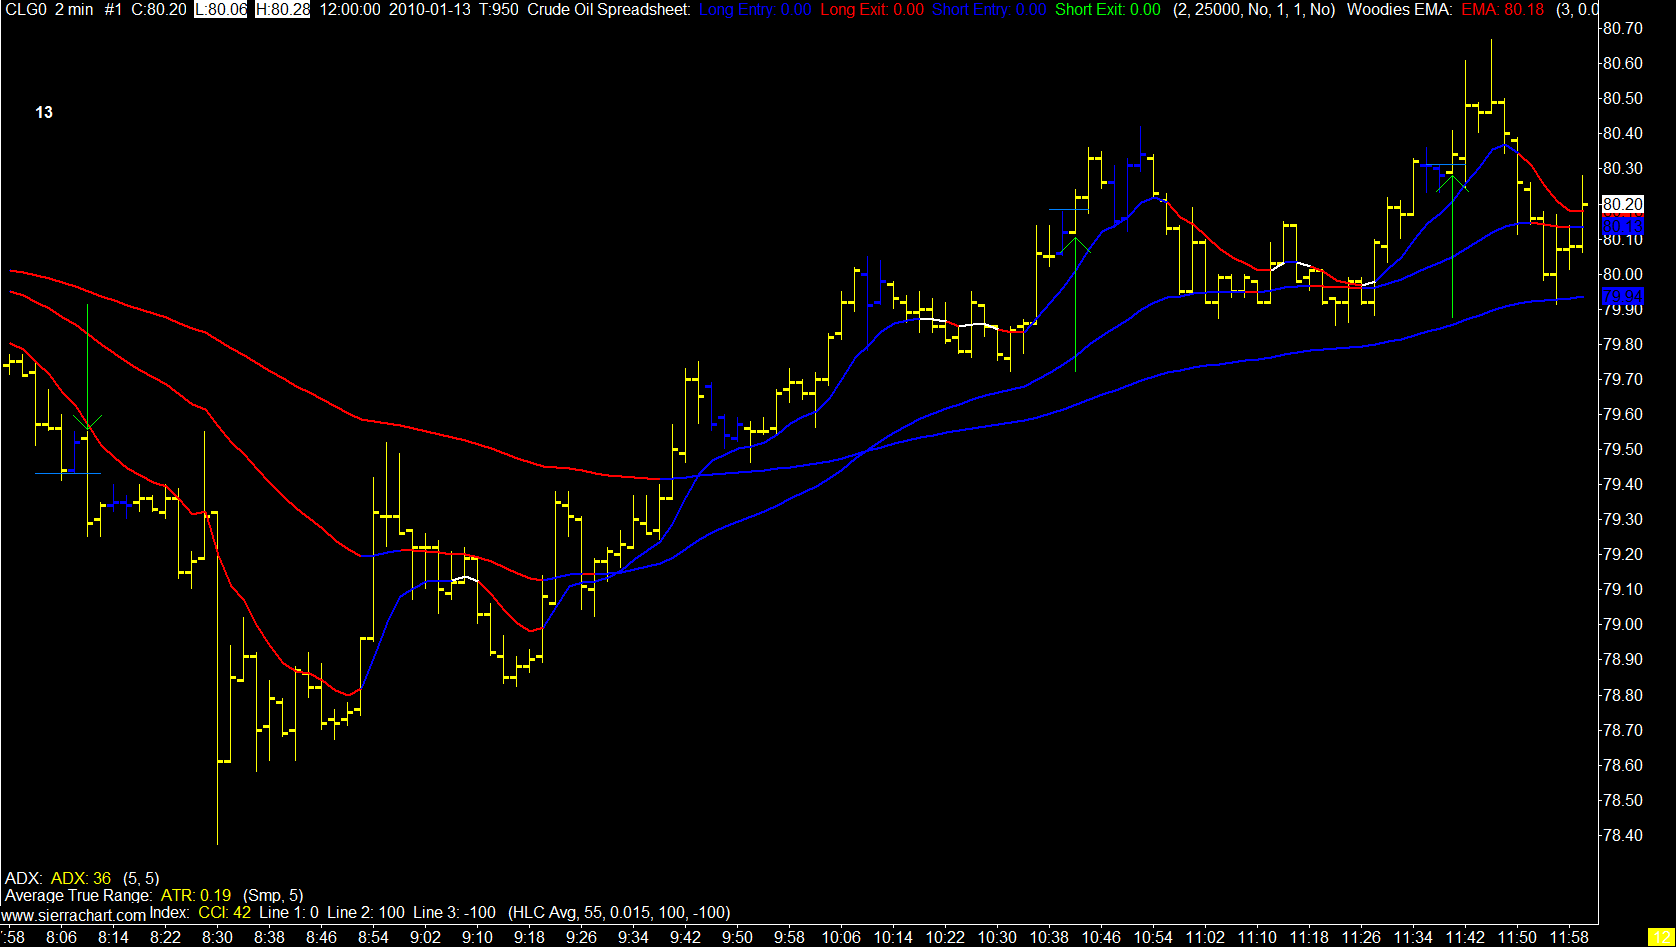
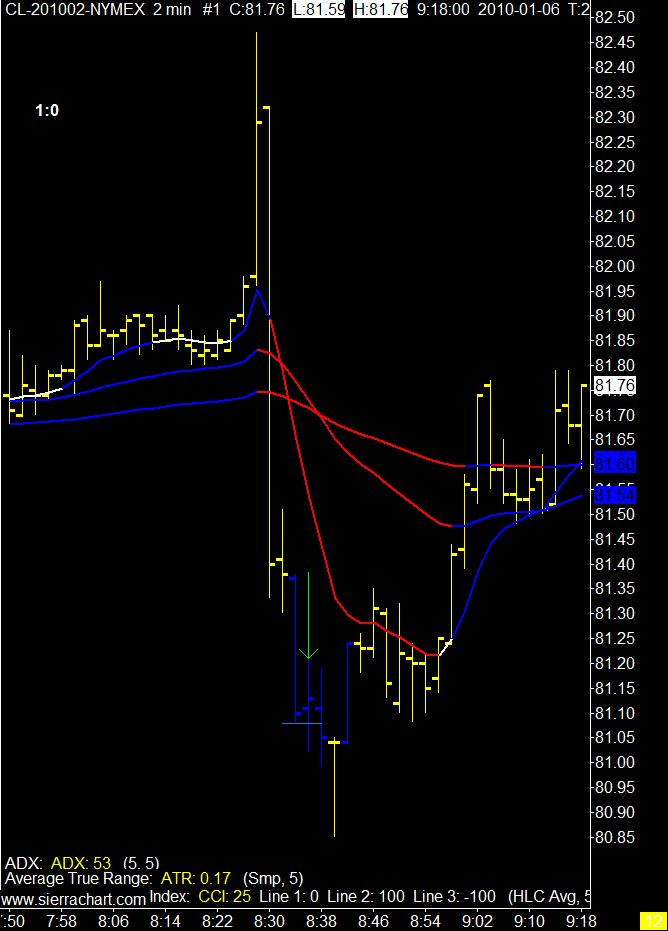
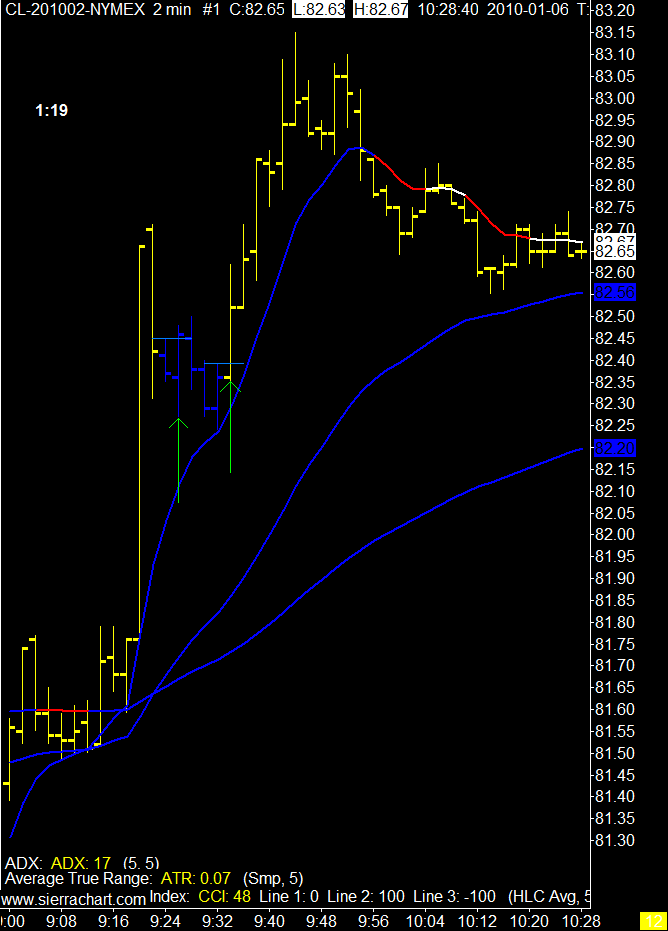
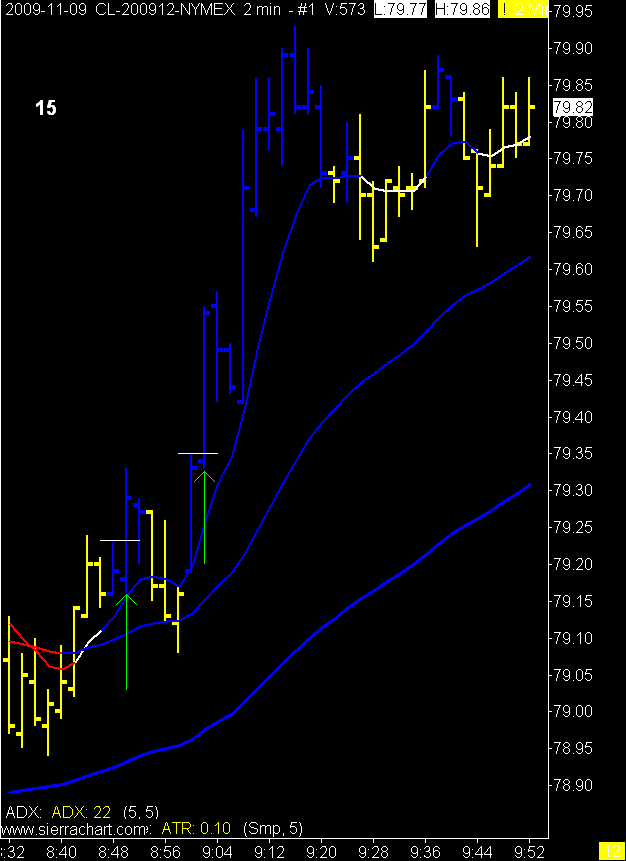
 As for Wednesday November 4th, 2009.
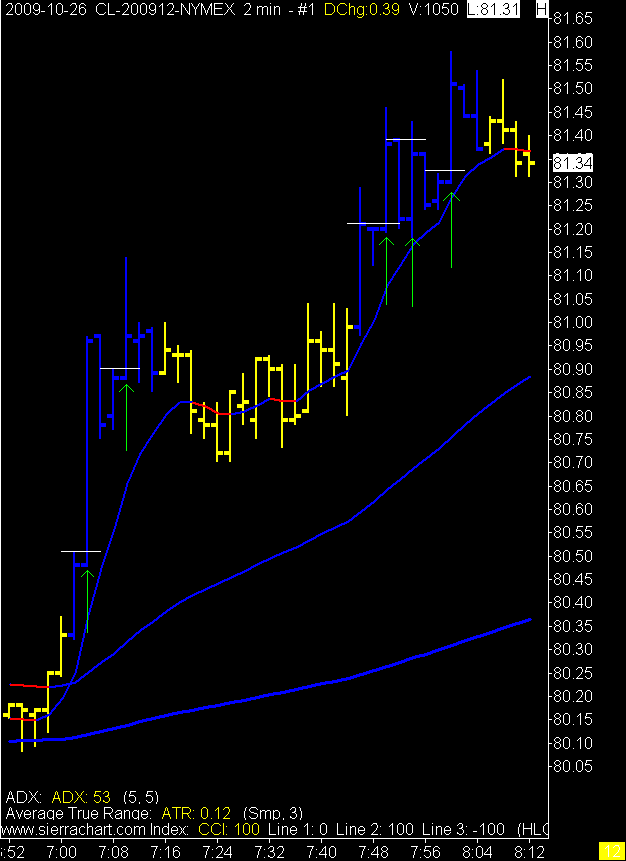
 I hit my daily stop with a small profit and then simmed my way to a much larger imaginary profit.