Showing posts with label renko chart. Show all posts

8/27/2010

The Boy Who Cried Wolf

The week is done. A week of trading with all the fear, greed, regret, happiness, sorrow, and every other emotion you can think of.

The weeks are all pretty much like that.

How we handle the changes in our emotional environment determines our success or failure.

The market has nothing to do with our success or failure.


P.S.

This is not a good bye post, because I don't do good bye posts anymore. I have had a few of those and then always came back to the blog. So if it was a good bye post you would have no reason to believe me.

Right.

8/25/2010

An Odd Business

Barrel count didn't work out and I thought the day was done.

Good thing I was "prepared to be wrong" as the day worked out well.

8/28/2008

Trade What You See

Hurricanes, Wars, GDP, all bullish for oil.

Right?

Wrong, oil goes down.

I don't know why, and most importantly I should not care why.

I'm supposed to trade what I see, not what I (or anyone else) think.

I took a couple of trades as oil was breaking $120 this morning. I was expecting a big upside move if we could get through $120. We got through $120.

Then we went down.

I hit my daily stop and was not able to participate in the nice downtrend later in the session.

That's my plan.

I trade my plan.

13 Tick Crude Oil Renko Chart (click to view)

8/19/2008

Renko Rides Trend to the End

The day started out very slow and I got a little anxious and took a trade before the EMAs were all on the right side of each other. Fortunately I got a break even on that one and then next one exploded to the upside.

The Renko bars called the top of trade and I got out with the ADX color change.

Nice day to trade crude oil.

13 Tick Renko Crude Oil Chart (click to view)

8/07/2008

Crude Oil Renko Chart

I have been looking at Renko charts for the past couple of days and traded it live today for the first time.

Thanks to J the FX wizard for the heads up on Renko charts.

There doesn't seem to be alot of info on the web about Renko charts so if you have anything to offer please post your comments.

This is the Investopedia information.

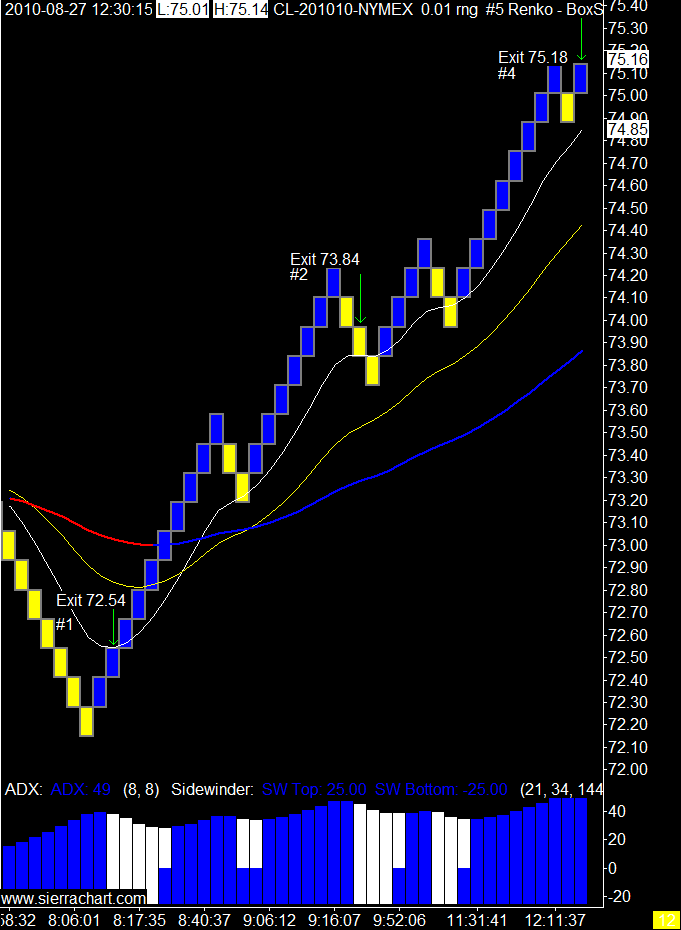
A type of chart, developed by the Japanese, that is only concerned with price movement; time and volume are not included. It is thought to be named for the Japanese word for bricks, "renga". A renko chart is constructed by placing a brick in the next column once the price surpasses the top or bottom of the previous brick by a predefined amount. This type of chart is very effective for traders to identify key support/resistance levels. Transaction signals are generated when the direction of the trend changes and the bricks alternate colors.

I have been using range bars for my entry chart and the renko bars are just a different type of range bar. The key being they have to move past the previous bar by the set number of ticks you choose, not just oscillate in that range.

We shall see how things go from here but I like what I see so far.

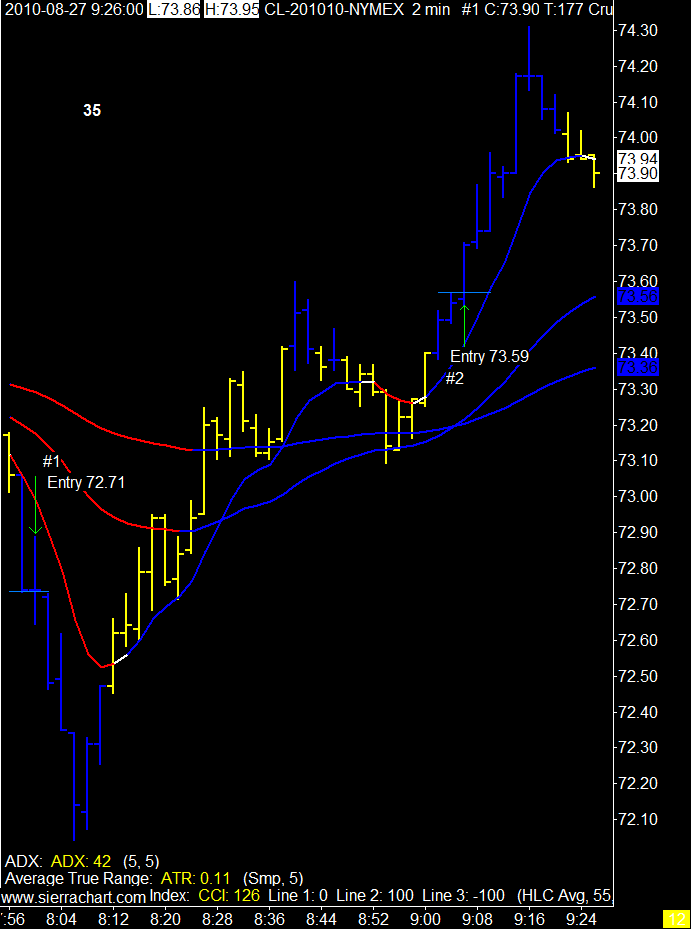
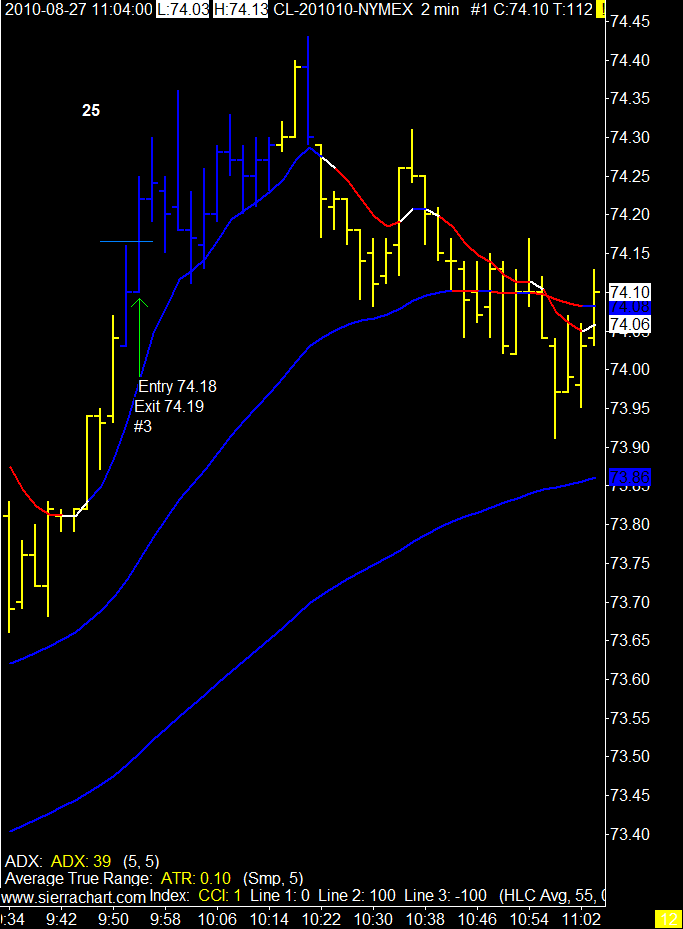
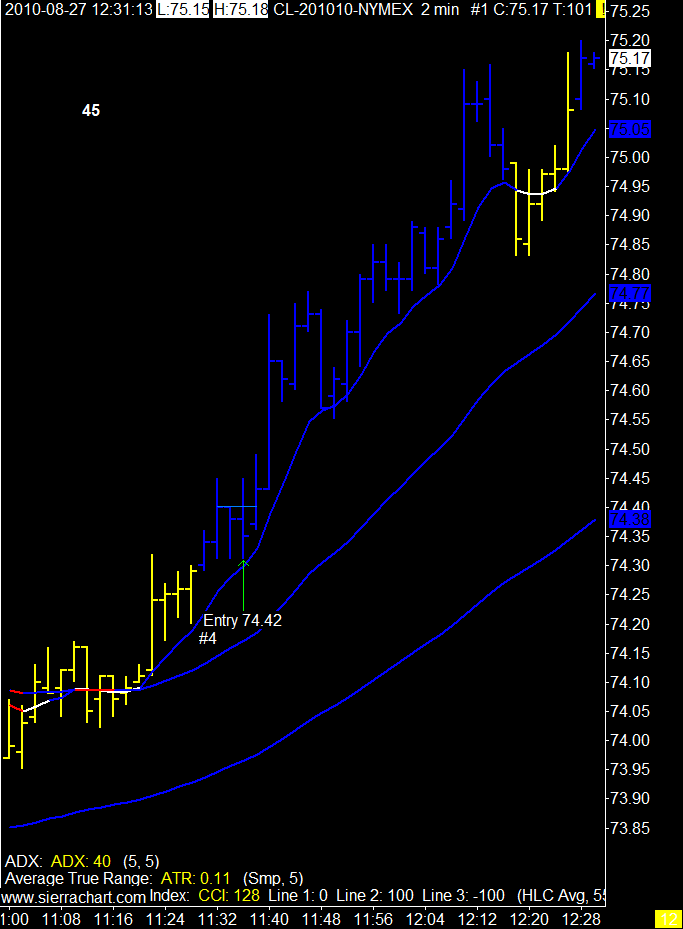
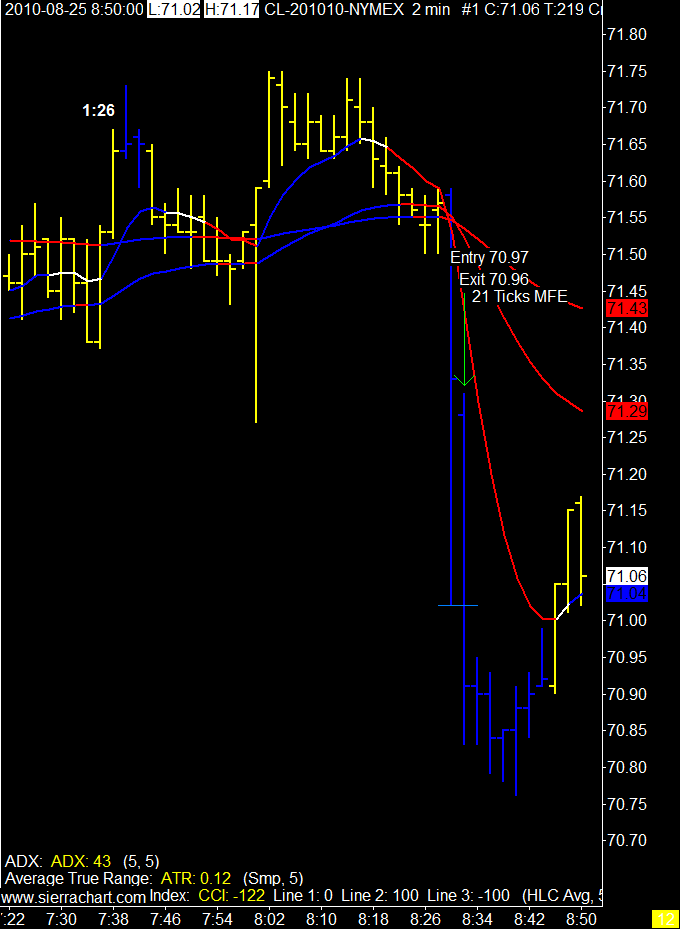
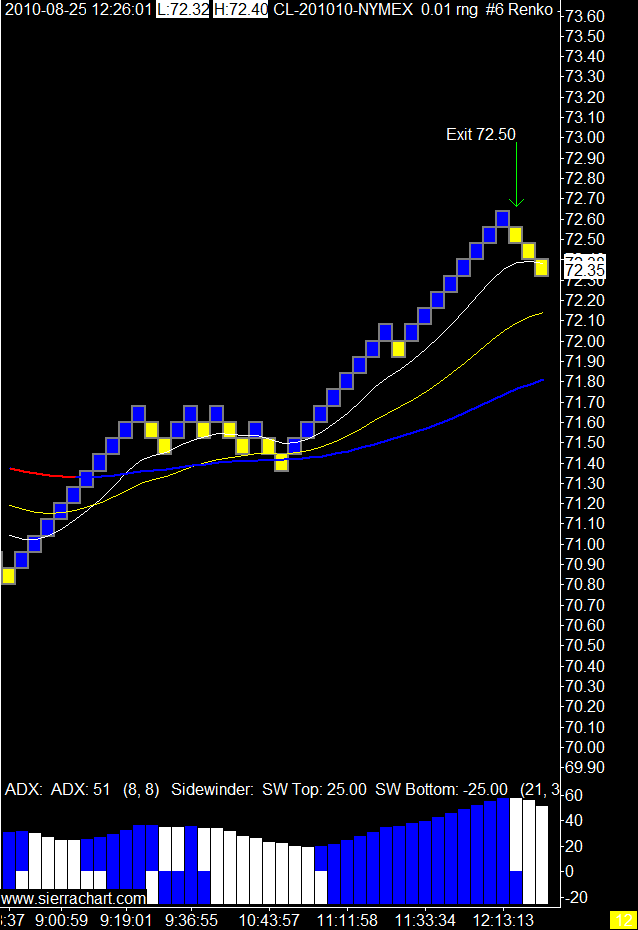
Only 2 signals today as I waited for a previous low to be taken out before entering.
One winner and one loser and a nice demonstration of let your winners run and cut your losers quick. The daily reward / risk ratio was 7.76.

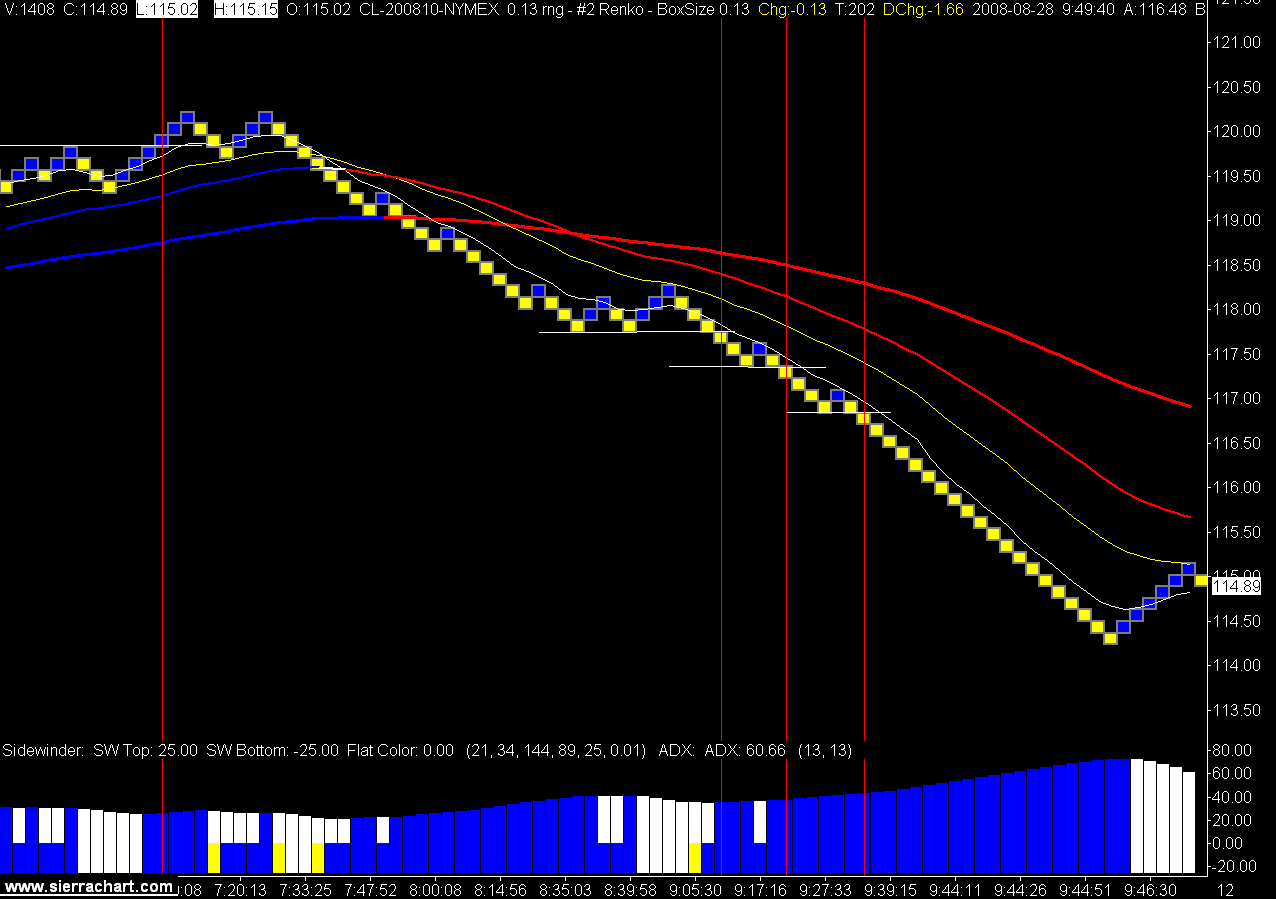
13 Tick Renko Range Bar Chart (click on chart to view)