8/06/2009

Bah!

Humbug

What a mess, took the longs, missed the shorts, done for the day. We're off on a little trip so may not trade tomorrow.

2 Minute Crude Oil Chart
On another note China may have found the cure for all the investment fraud we have seen in North America lately.

8/05/2009

Who Am I

If I'm the "weakened animal" Satyajit Das is talking about in Traders Guns & Money then I guess I'm ok with it. Although I could be the hyena, no let the institutional traders be hyenas, I'll be the wolf.

The reality is I'm too small a trader for anyone to notice, and that's just fine by me. I'm not leading the market, I'm following. Unfortunately that does make me look more like a hyena then a wolf.

Oh well.

1 Minute Soybean Charts

2 Minute Crude Oil Charts

'Beautiful Lies'

I am currently reading Satyajit Das's book, Traders Guns & Money. I'm loving it and find myself continually laughing out loud.

The back cover of the book describes it as "a wry and wickedly comic expose of the culture, games, and pure deceptions played out every day in trading rooms around the world, usually with other peoples money".

Here are a few samples.

"Beautiful lies' are the lies that we like to believe; we know they are not true but everything makes us want to believe them - that is what makes them beautiful.

I used to be responsible for showing the trainees around the trading floor. 'Look, it's quite simple, I said, breaking down the hierarchy of the trading floor. 'There are salespeople - they lie to clients. Traders lie to sales and to risk managers. Risk managers? They lie to the people who run the place - correction, think they run the place. The people who run the place lie to shareholders and regulators.' I remembered our quantitative colleagues. 'I forgot the quants - our fabulous rocket scientists! When last heard from, they were trying to develop a model for lying.'
'And clients?' one of the trainees asked tentatively. I thought about it for a few seconds. 'Clients. They lie mainly to themselves!' To enter the world of derivatives trading is to enter a realm of beautiful lies.

There is only one way to make money - you buy low and sell high. Sorry, forgot the second rule - sell high, buy low. Listening to traders you get an entirely different view of their business, especially its complexity.

Some traders engage in elaborate analysis of market forces. There is technical analysis consisting of trying to find patterns in price movements over time, there are head and shoulders, rising and falling pennants, retracement points, resistance lines, oscillation indexes, RSI (relative strength indicators, not repetitive strain injury). There are more arcane techniques - Elliot waves, Fibonacci series, Japanese candle stick techniques. The list is endless. It is a modern version of reading the entrails of a slaughtered ox.

Success in trading relies on on simple rules. Overwhelming force is generally good - you just have more money than everybody else and can hang on until everybody is forced out of the game. Ganging up is effective - you just get together with other traders and fall upon a weakened animal like hyenas or wolves. Ambush is also good - you know something that the other guy does not know, at least not yet. Flow traders are well versed in ambush. It also helps to be lucky - better to be a lucky fool than an unlucky genius." Satyajit Das, Traders Guns & Money
Traders, Guns & Money: Knowns and unknowns in the dazzling world of derivatives

I believe we, the independent traders, are the weakened animal that the institutional hyenas devour.

The line about technical analysis being the "modern version of reading the entrails of a slaughtered ox" is my favourite.

Of course that doesn't include my magic blue bars, right?

8/04/2009

Crude Rolls On

Crude is restoring my faith in things that go up and down and make shiny blue bars.

2 Minute Crude Oil Chart
The first trade's entry bar was blue when I entered and then went yellow as it closed under the EMA, still a valid signal and worked out to target. I should not have taken that third trade (short) as the short EMAs were still on top of the long EMAs, and I got smacked for my efforts.

Still a nice day.

Soybeans were quiet again with one nice move that I didn't take as I was done after the early crude trading. This soybean chart can go in the business plan as the ultimate signal, we see the range expand, bars go blue, pull back to the EMA, break of previous bar high off the bounce, in we go, target we hit.

It could be the best trade set up I never took.

1 Minute Soybean Chart

8/03/2009

Renko Bars and Range Bars

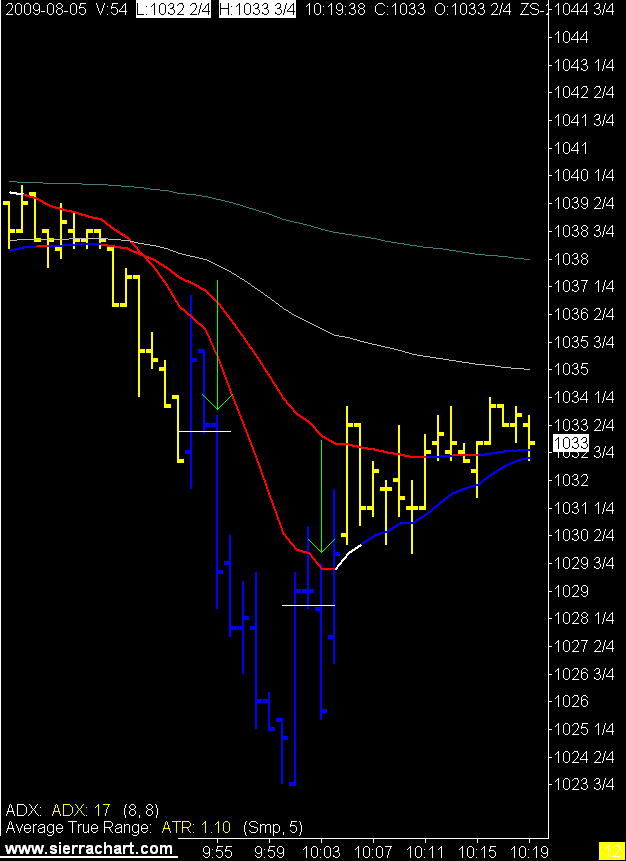
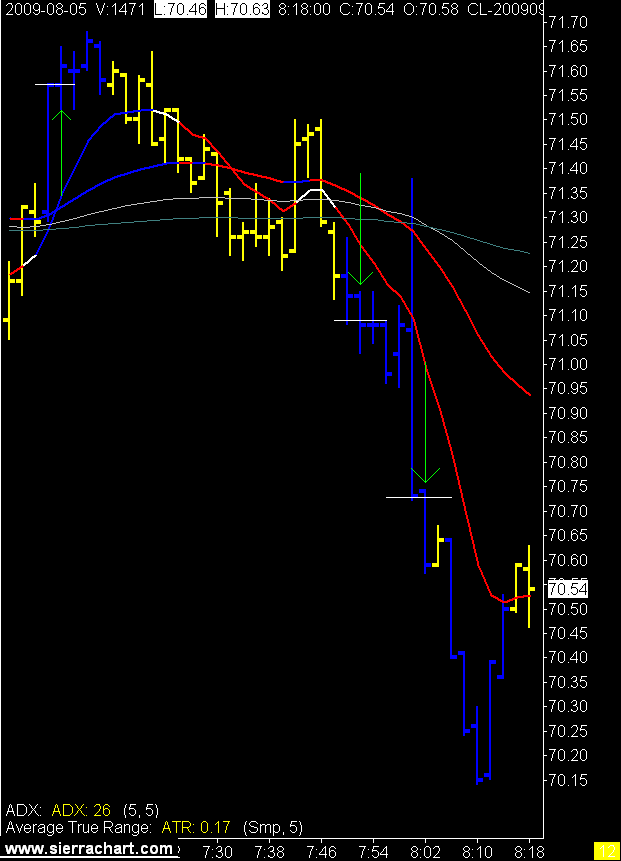
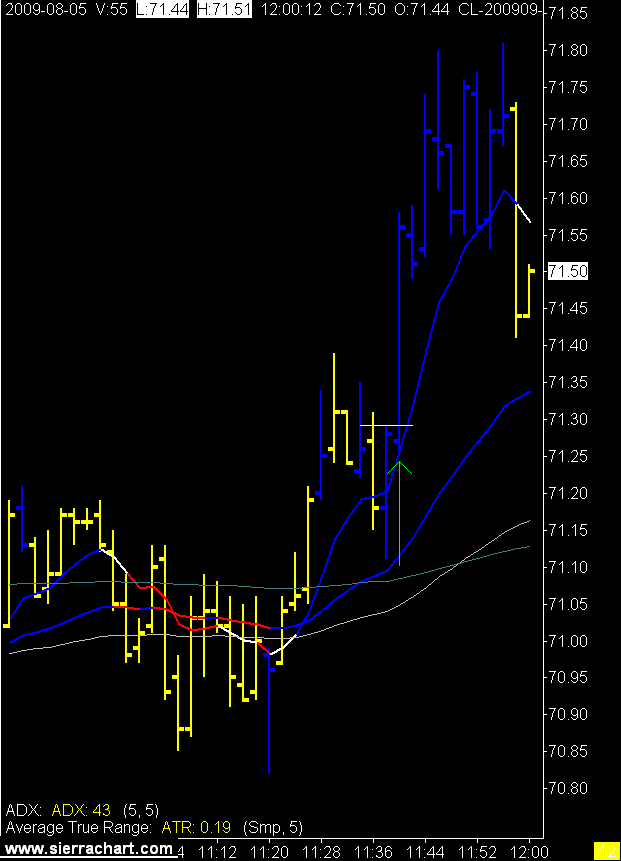
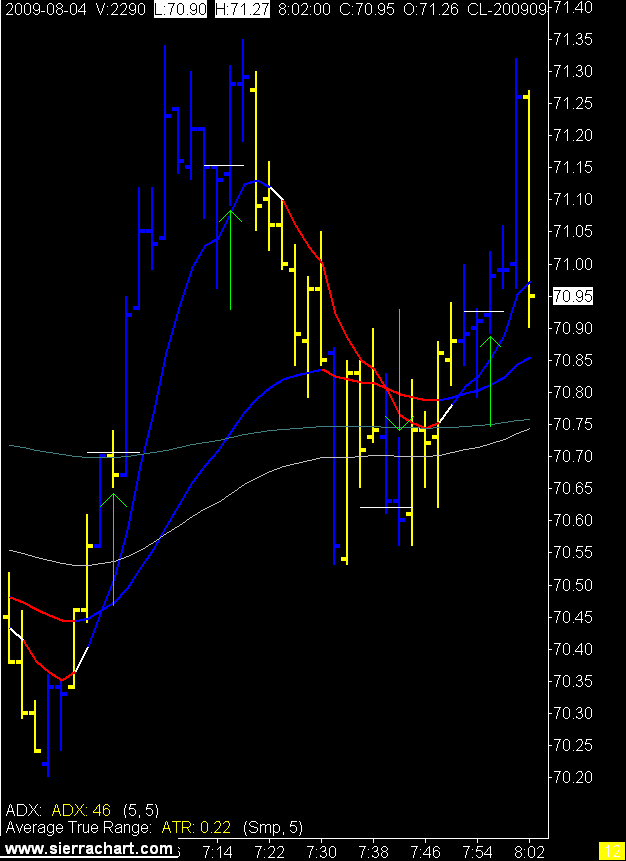
WARNING: This post is very long and has no pictures. If this alarms you skip down to the next post which has few words and shiny pictures of charts.

Pandu the FX trader from Australia asked me this on an old post.

"I want to know what do you mean by 'The hard stop value is set as a % of the range bar we are trading.'. What is the meaning of 'Range Bar'? Also, what parameters do you use for the ADX you use?"

So that along with all the google searches for renko bar trading I get on this blog I thought I should take a moment and discuss why I quit using range bars and or renko bars.

In a word, time.

We all have access to the same data, we all live in the same space and time continuum. I heard that on Star Trek I think.

I don't move the market. I want to be looking at what most everyone else is looking at. Why? Because I'm going to ride along with whomever, collectively or all by themselves, does move the market.

So we're all looking at price move and we are all breaking down that price action with different methods. We have volume, time, and tick data and all of it tracks the same price but presents the trader bar closes in different ways. I want to look at the chart picture with the method, time, that I think most other traders are using. Note I said think, not know.

Of course everyone who uses one of those categories thinks it is the best. Until they change, just like I have. :)

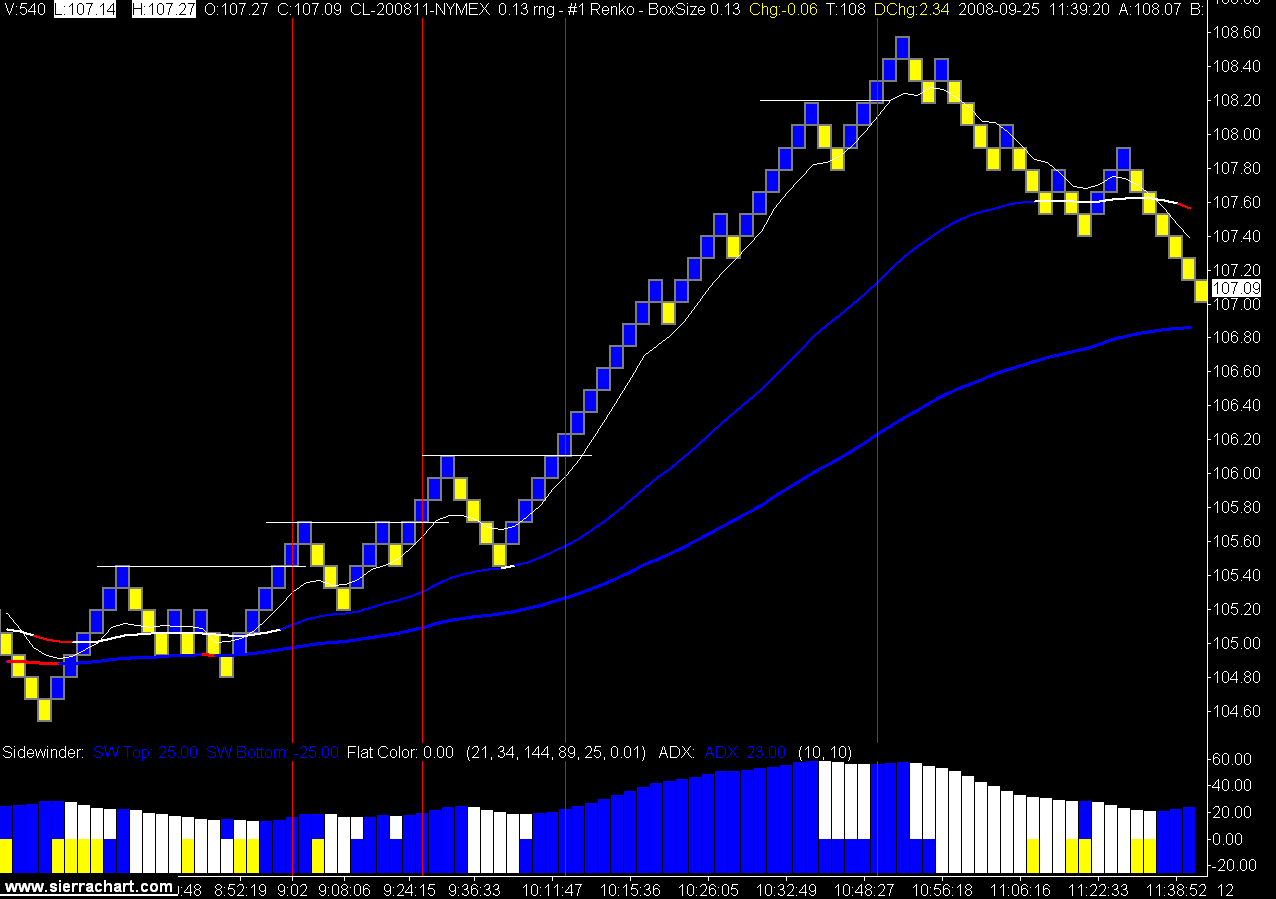
Back to Pandu's question. The range bar measures a set range of price movements and when that range is met the bar prints.

A renko bar does the same except the range has to be all in one direction for the bar to print. So with a 10 tick renko bar the range has to be all up or all down for it to print. A 10 tick range bar could open at 70.25 and have 5 ticks up to 70.30 and 5 ticks down to 70.20 and the bar would print. A 10 tick renko bar would have to have 10 ticks up to 70.35 or 10 ticks down to 70.15 before it would print.
There are other little nuances to them both depending on your chart service but I'm not going into that here.

Got it? I hope so it exhausted me explaining it.

So the benefits to both are when price moves quickly the bars start printing. We need the bars to print in order for our indicators to, well, indicate. It may be a shock for some but all our indicators are lagging. Sorry. They need the price bars to move in order for them to do their "magic".

This all sounds good and works for many people, like the man who loves rain (Rainwater) and really wants to be included in Jules private blog but is too shy to ask. (Rainwater uses range bars not renko bars)

Actually it sounds so good it's making me wonder why I gave them up?

Renko, I gave up because there can be too much intra bar movement and it is too hard to find your way in with renko alone. I started using time charts with renko and then eventually just dumped the renko. Renko charts are great for keeping you in a trade and could be used for a technical exit, but then I started trading for a target rather than a technical exit so renko went bye bye.

Range bars are probably of more use but I found they gave me too many false starts and I need to control my pushy the button fingers.

I control them with time.

Time, I have to wait. I use 1 and 2 minute bars so I don't wait for long but for me, let me say again, for me, I find that time works the best.

Am I late sometimes? Yes. I give that up in order to stay out of some false moves.

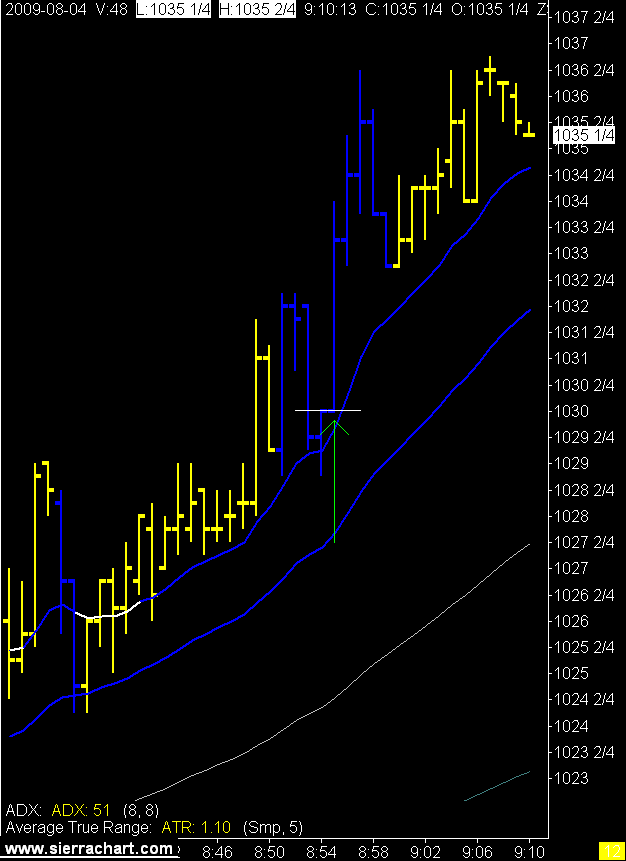
So there it is, my trading still looks at range via the ATR, I need to see some movement in one direction via the ADX, I need price on the right side of the EMA's, I look for a higher high or lower low and away we go.

The longer multiple EMAs are there to simulate what a longer term chart would be showing in terms of trend and direction. Like a 5 and 15 minute chart or so.

This is a very long post with no pictures which may be alarming to some. I better place a warning at the top of this post.

Oh yes the rest of Pandu's questions. My stop on the range or renko bar was a % of the bar I was using. So for a 20 tick range bar I may use 75% of that as a stop, 15 ticks. With the ADX and ATR I am looking for a minimum threshold to be met before I start looking for signals. That's all.

P.S. Those renko bar charts were sure pretty.

Home

The World Was Flat

I was complaining that soybeans had not offered much to trade in July. Looking at the daily chart for July you can see why. When the world is flat stay on the beach.

Daily Soybean Chart
Crude on the other hand has been anything but flat and the opportunities to trade intraday have been plentiful.

Daily Crude Oil Chart
The message is, listen carefully now the guru is speaking, trade the bumpy chart not the flat one.