
Showing posts with label 2 minute crude oil chart. Show all posts
Showing posts with label 2 minute crude oil chart. Show all posts
8/24/2010
11/10/2009
The Two Faces of Solfest
Daytrader 233 wrote a blog post about his mental status during and after a successful trade.
I thought I would add to the conversation with my two trades today. Trade number 1, which I have titled, I am moron, shows a big up move with many blue bars and the cheers of successful traders along the way.
Solfest's entry endured heckling from the peanut gallery and ended with tears and the gnashing of teeth.
I am moron.
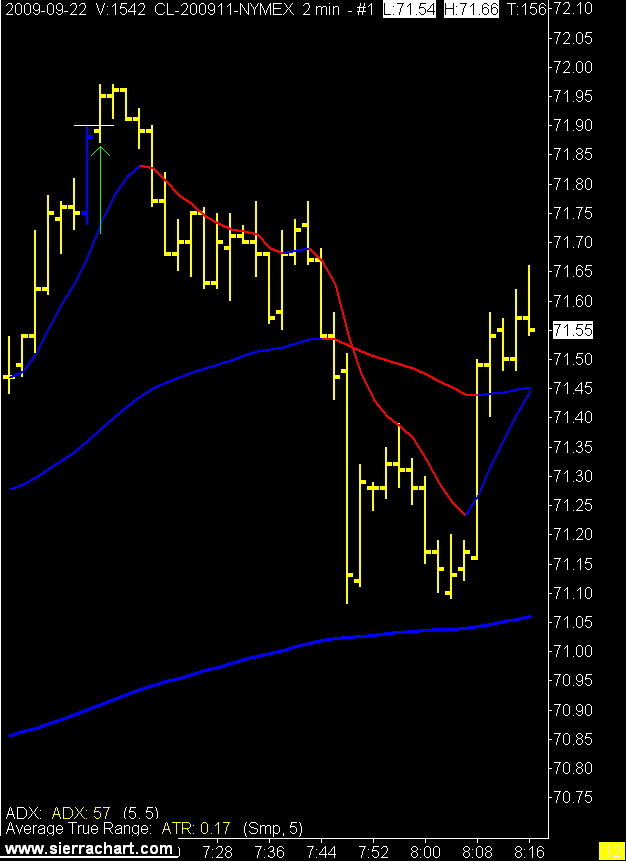
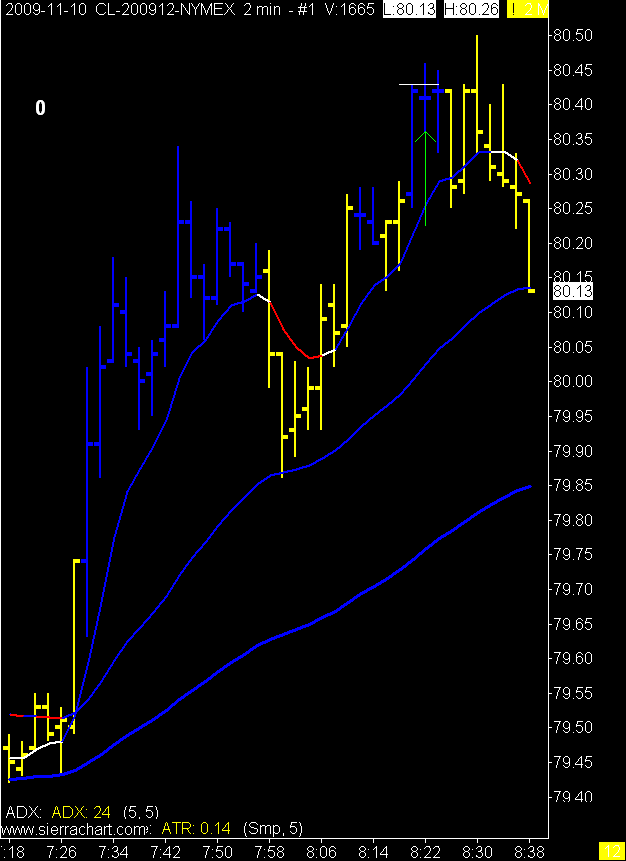 Trade number 2 which I have titled, I am genius, shows a nice downtrend, a thoughtful entry, and target reached.
I am genius.
 The truth of the two trades is that both were successful. Both trades met my guidelines completely, I took both trades and executed the in flight plan perfectly, and I accepted the outcome from both as part of the business.
Money management took 13 ticks on one and money management gave 55 ticks on the other.
The moral of the story is I am neither moron or genius, (although I am human and therefore could be stupid) I am simply following a plan that has statistical merit.
It's just that easy.
HA!
It's never easy, unless you can somehow get into the Long & Wrong robotic mindset and stay there. I get there, but I don't always stay there. I guess I am stupid.
But I'm not a moron or a genius, I'm a trader.
I thought I would add to the conversation with my two trades today. Trade number 1, which I have titled, I am moron, shows a big up move with many blue bars and the cheers of successful traders along the way.
Solfest's entry endured heckling from the peanut gallery and ended with tears and the gnashing of teeth.
I am moron.
Trade number 2 which I have titled, I am genius, shows a nice downtrend, a thoughtful entry, and target reached. I am genius.
The truth of the two trades is that both were successful. Both trades met my guidelines completely, I took both trades and executed the in flight plan perfectly, and I accepted the outcome from both as part of the business.Money management took 13 ticks on one and money management gave 55 ticks on the other.
The moral of the story is I am neither moron or genius, (although I am human and therefore could be stupid) I am simply following a plan that has statistical merit.
It's just that easy.
HA!
It's never easy, unless you can somehow get into the Long & Wrong robotic mindset and stay there. I get there, but I don't always stay there. I guess I am stupid.
But I'm not a moron or a genius, I'm a trader.
9/23/2009
Swinging the Bat
A hitter in baseball can fail 70% of the time and still be an all star. I coach minor baseball (little league) and spend a fair amount of time reminding my players of this fact. They want to get a hit so bad, for Mom, Dad, Grandma, Grandpa, that I quite often see them coming back to the dugout in tears if they don't succeed at the plate.
Sounds alot like traders. You can have a very successful plan with a winning percentage under 50% with proper money management. Yet how many of us (me being part of us) come back to the dugout after a losing trade looking like we just lost our best friend.
As I tell the 10 yr old baseball players, the key is not to focus on what just happened, the key is are you ready for your next at bat.
Are you?
Am I?
Solfest after a losing trade
Yesterday's strikeouts.
Today, a couple of homeruns.
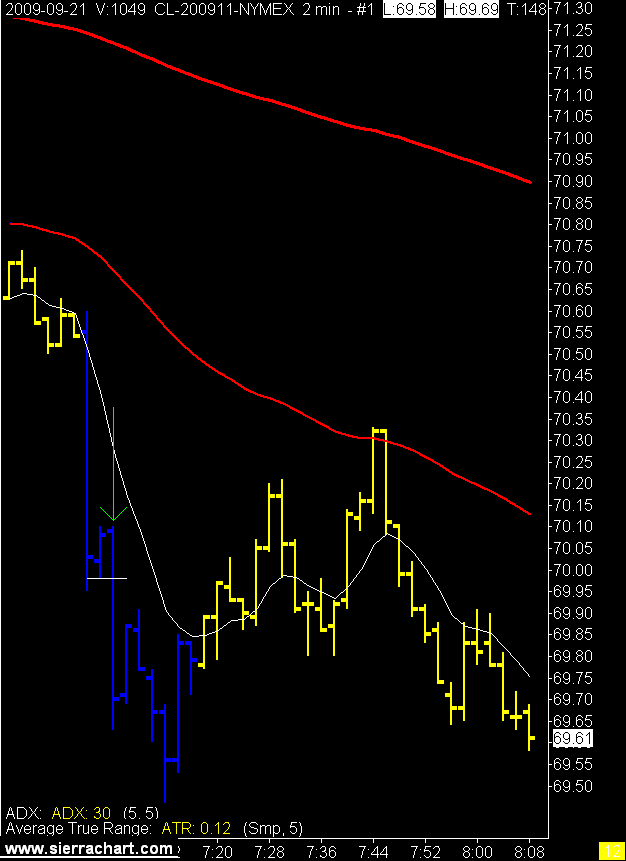
9/21/2009
Testing 1 2 3
Nice day today, took the boy to his 6:30 am hockey practice, went to Tim Hortons and got a coffee, came home and did some reading, opened charts, saw a strong signal, entered as planned, trade hit target, puffed out chest with pride, and then.......
Then I started to fiddle with some charts. No problem we traders always fiddle with charts, nothing major, brought up a 15 minute chart to look at this huge downtrend we were in, yep it's a huge downtrend, not sure why I needed the 15 minute to see that.
I have had a tick chart up for the past few days with my 2 minute chart study on it and have been tracking the results of my 2 minute trades with and without agreement on the tick chart. As I brought up the new 15 minute chart I must have re arranged the order on the monitor. I always have the chart I'm trading on the right hand side of the monitor so it is next to the DOM on the left hand side of the other monitor.
Somehow the tick chart wound up on the right hand side. I took the next 2 signals for full stops thinking I was seeing them on the 2 minute chart. Was also thinking I'm on to something here as there was no congruence on what I thought was the tick chart.
So in fact what your humble scribe (can't call myself a trader today) was doing was taking signals off the tick chart and looking for congruence on the 2 minute chart. Exactly the opposite of what I'm supposed to be doing.
Oops.
Let's just keep this between ourselves.
Thanks.
Now the 15 minute chart is back in the bin, the 2 minute chart is back on the right hand side of the monitor, and I promise to leave well enough alone.
You can't see if my fingers were crossed when I promised that though.
This was the only valid signal, yes it was blue on the tick chart as well.
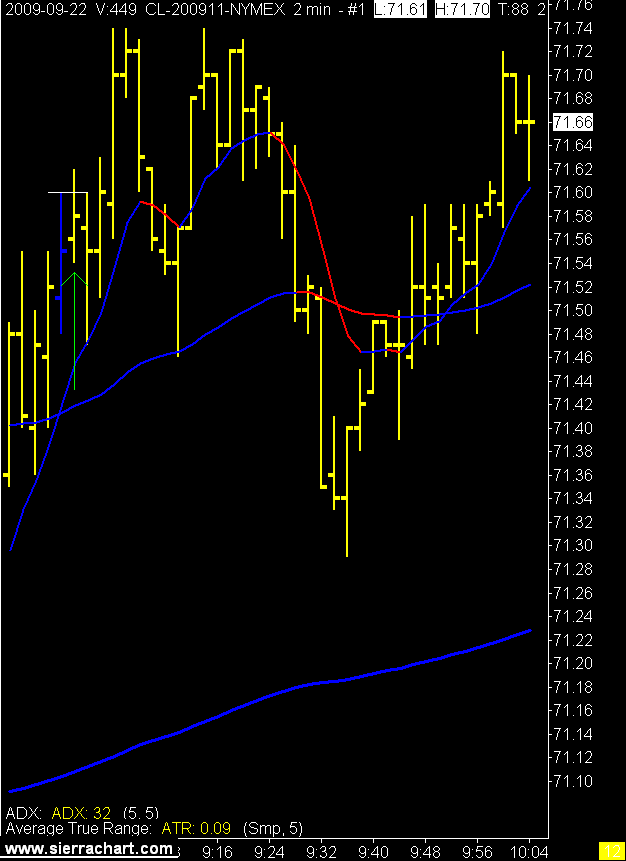
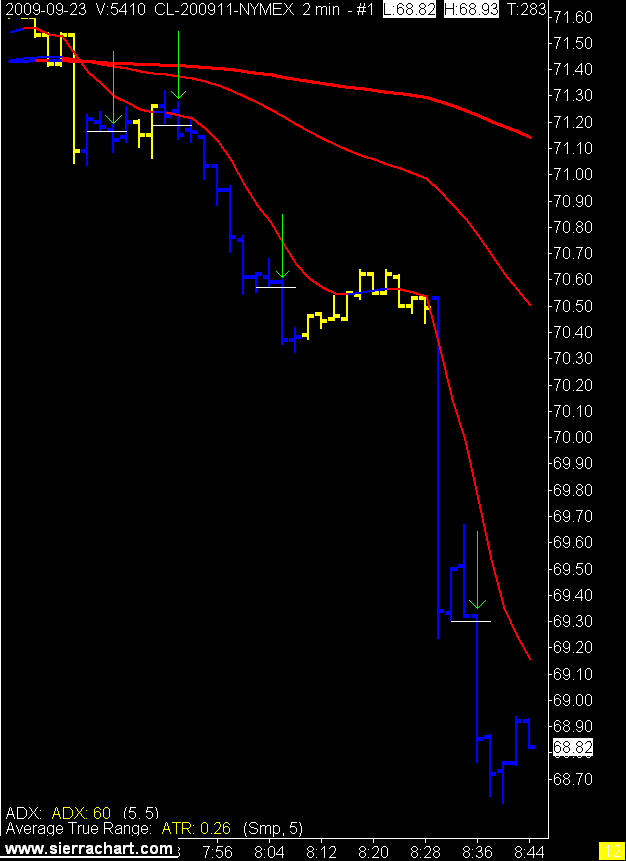
2 Minute Crude Oil Chart
Then I started to fiddle with some charts. No problem we traders always fiddle with charts, nothing major, brought up a 15 minute chart to look at this huge downtrend we were in, yep it's a huge downtrend, not sure why I needed the 15 minute to see that.
I have had a tick chart up for the past few days with my 2 minute chart study on it and have been tracking the results of my 2 minute trades with and without agreement on the tick chart. As I brought up the new 15 minute chart I must have re arranged the order on the monitor. I always have the chart I'm trading on the right hand side of the monitor so it is next to the DOM on the left hand side of the other monitor.
Somehow the tick chart wound up on the right hand side. I took the next 2 signals for full stops thinking I was seeing them on the 2 minute chart. Was also thinking I'm on to something here as there was no congruence on what I thought was the tick chart.
So in fact what your humble scribe (can't call myself a trader today) was doing was taking signals off the tick chart and looking for congruence on the 2 minute chart. Exactly the opposite of what I'm supposed to be doing.
Oops.
Let's just keep this between ourselves.
Thanks.
Now the 15 minute chart is back in the bin, the 2 minute chart is back on the right hand side of the monitor, and I promise to leave well enough alone.
You can't see if my fingers were crossed when I promised that though.
This was the only valid signal, yes it was blue on the tick chart as well.
2 Minute Crude Oil Chart

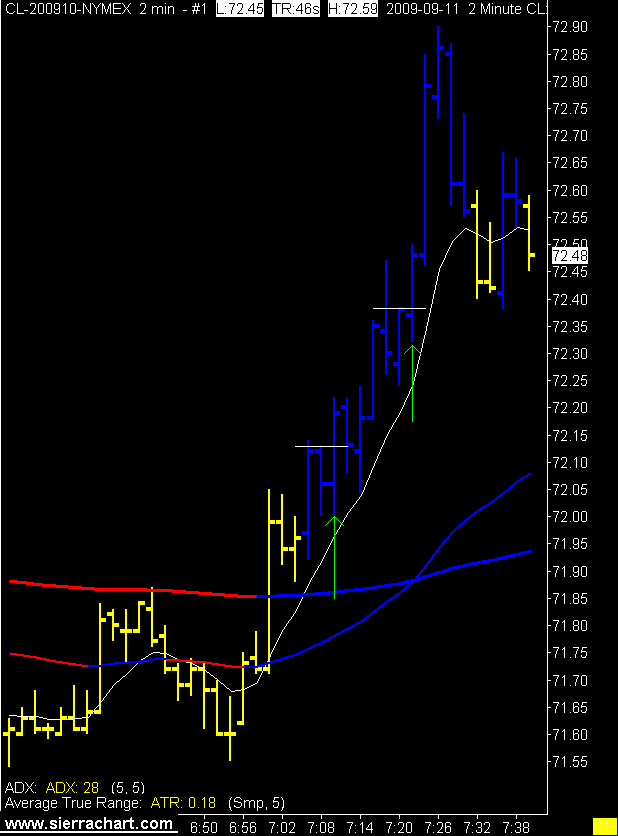
9/11/2009
More Charts
2 Minute Crude Oil Charts

 Some nice moves in the crude oil market today. I'm sure DT is going to ask so here are the results. The first signal hit target, I missed the second one, third one hit target, and the fourth one was a full stop out.
Have a nice weekend everyone.
Some nice moves in the crude oil market today. I'm sure DT is going to ask so here are the results. The first signal hit target, I missed the second one, third one hit target, and the fourth one was a full stop out. Have a nice weekend everyone.
A Chart
2 Minute Crude Oil Chart
 I moved the stop to break even + 1 a little early on the first signal and that's what I got. It then ran to target of course. Fortunately I got a second chance and behaved myself as it hit my target.
This machine is running vista so things look a little different. I had to program sierra again as I had not updated it as per the settings on my regular trading computer. I dropped one EMA as it seemed redundant. Hopefully the other comp gets back into service today as I can only run one monitor with this one.
I moved the stop to break even + 1 a little early on the first signal and that's what I got. It then ran to target of course. Fortunately I got a second chance and behaved myself as it hit my target.This machine is running vista so things look a little different. I had to program sierra again as I had not updated it as per the settings on my regular trading computer. I dropped one EMA as it seemed redundant. Hopefully the other comp gets back into service today as I can only run one monitor with this one.
8/27/2009
The Swami Speaketh
I find you odd.
Yes, you.
You never know what kind of post topic is going to push trader's buttons, so to speak. Jules said I was sounding swami like with my previous post. The EIT (exceptional Irish trader) had told me the same thing after he read that post. Ok he actually called me guru like.
I found this all rather offensive as I thought I had just posted a blog stating that I don't want to be your guru.
Maybe I do?
No
I don't.
I thought my point about what market do you trade was important. I still do. I think it's very important. In fact I think it is the most important factor after money management. So I offered what I thought was a very simple way to gauge different markets in order to see if there might be something else out there that you could trade. There may be something better than crude oil, if so let me know. Crude isn't always the best thing to trade as there are many posts on this blog with me whining about the lack of signals on crude oil.
Anyway I thought it was important but I get the feeling that you don't. Maybe I didn't say it right, or maybe I sounded too swami like. If so I apologize.
What if all our plans, technical analysis, indicators, systems, didn't matter? What if the only thing that mattered was a market that will get in a trend and stay there for a while? If that were the case, or at least partially the case then maybe we should take a little time and examine the different products there are to trade. Maybe we should spend more time on that rather than hours of studying whether a 34 EMA is better than a 21 EMA?
You can look at daily or hourly charts with the ATR as a guide to quantify the products range. It doesn't really matter how you measure as long as you apply the same measurement to all the markets you want to look at.
That leads me to another point, the market you want to look at. People seem hesitant to look at something else, they get very attached to their market and they don't want to leave it. I know I am the same way, slow to change.
You don't have to change, just look. Measure a few different markets and if something jumps out at you sim trade it for a while. Yes the power of sim, you don't have to dive into the crude oil pit head first (oops I let that crude bias slip out there) you can sim trade.
Why not?
Since I'm wagging crude's tail today have a look at the chart. I know, I know, you're saying, will he just shut up and post some charts!
Fine, be that way and since I am not your Swamiguru you can just look at the shiny chart and forget everything I said. :)
2 Minute Crude Oil Chart
 I took the first two and passed on the last two.
Yes, you.
You never know what kind of post topic is going to push trader's buttons, so to speak. Jules said I was sounding swami like with my previous post. The EIT (exceptional Irish trader) had told me the same thing after he read that post. Ok he actually called me guru like.
I found this all rather offensive as I thought I had just posted a blog stating that I don't want to be your guru.
Maybe I do?
No
I don't.
I thought my point about what market do you trade was important. I still do. I think it's very important. In fact I think it is the most important factor after money management. So I offered what I thought was a very simple way to gauge different markets in order to see if there might be something else out there that you could trade. There may be something better than crude oil, if so let me know. Crude isn't always the best thing to trade as there are many posts on this blog with me whining about the lack of signals on crude oil.
Anyway I thought it was important but I get the feeling that you don't. Maybe I didn't say it right, or maybe I sounded too swami like. If so I apologize.
What if all our plans, technical analysis, indicators, systems, didn't matter? What if the only thing that mattered was a market that will get in a trend and stay there for a while? If that were the case, or at least partially the case then maybe we should take a little time and examine the different products there are to trade. Maybe we should spend more time on that rather than hours of studying whether a 34 EMA is better than a 21 EMA?
You can look at daily or hourly charts with the ATR as a guide to quantify the products range. It doesn't really matter how you measure as long as you apply the same measurement to all the markets you want to look at.
That leads me to another point, the market you want to look at. People seem hesitant to look at something else, they get very attached to their market and they don't want to leave it. I know I am the same way, slow to change.
You don't have to change, just look. Measure a few different markets and if something jumps out at you sim trade it for a while. Yes the power of sim, you don't have to dive into the crude oil pit head first (oops I let that crude bias slip out there) you can sim trade.
Why not?
Since I'm wagging crude's tail today have a look at the chart. I know, I know, you're saying, will he just shut up and post some charts!
Fine, be that way and since I am not your Swamiguru you can just look at the shiny chart and forget everything I said. :)
2 Minute Crude Oil Chart
I took the first two and passed on the last two.
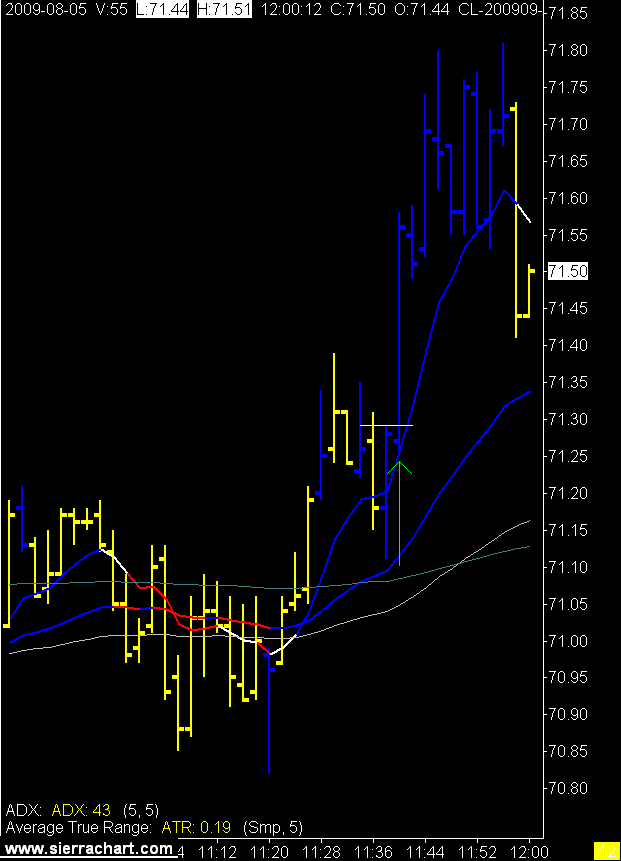
8/05/2009
Who Am I
If I'm the "weakened animal" Satyajit Das is talking about in Traders Guns & Money then I guess I'm ok with it. Although I could be the hyena, no let the institutional traders be hyenas, I'll be the wolf.
The reality is I'm too small a trader for anyone to notice, and that's just fine by me. I'm not leading the market, I'm following. Unfortunately that does make me look more like a hyena then a wolf.
Oh well.
1 Minute Soybean Charts

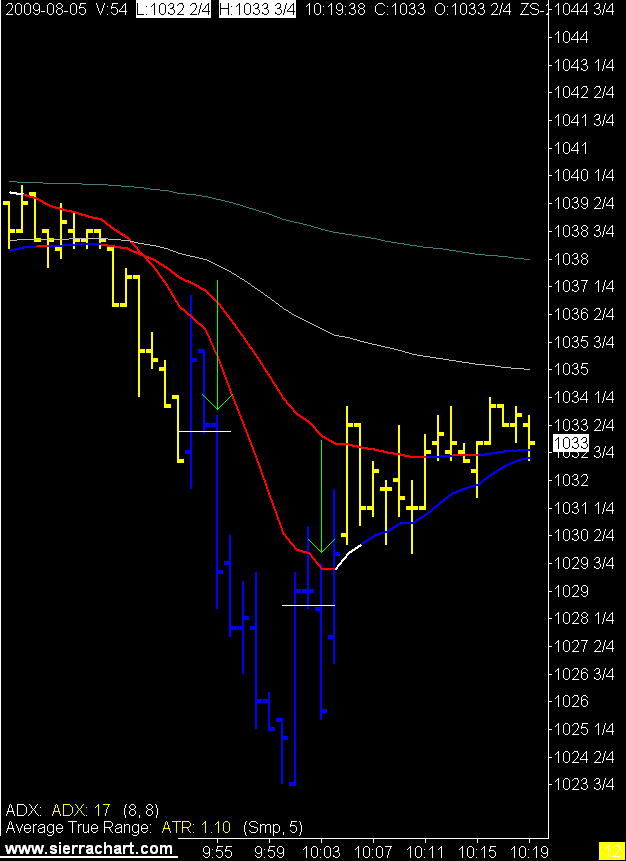
2 Minute Crude Oil Charts
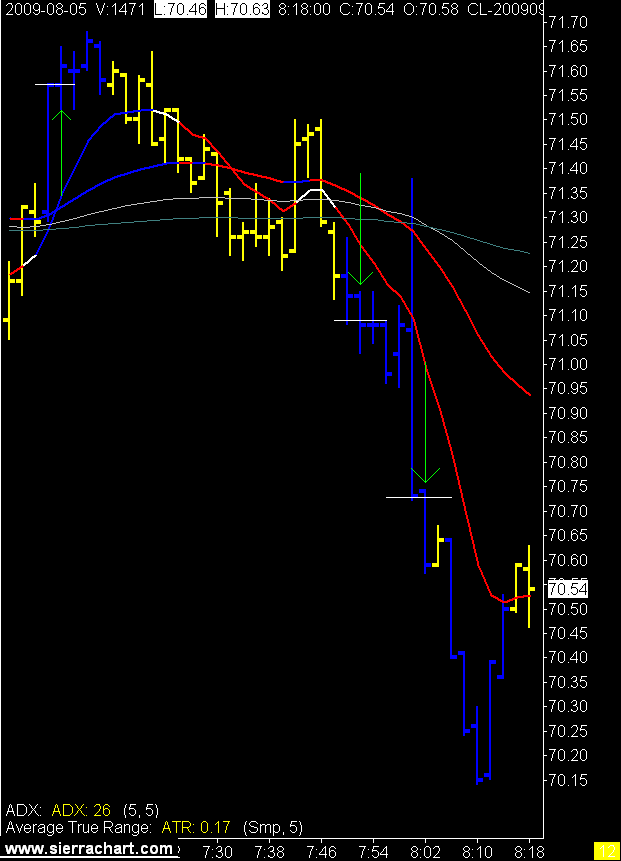
The reality is I'm too small a trader for anyone to notice, and that's just fine by me. I'm not leading the market, I'm following. Unfortunately that does make me look more like a hyena then a wolf.
Oh well.
1 Minute Soybean Charts
2 Minute Crude Oil Charts
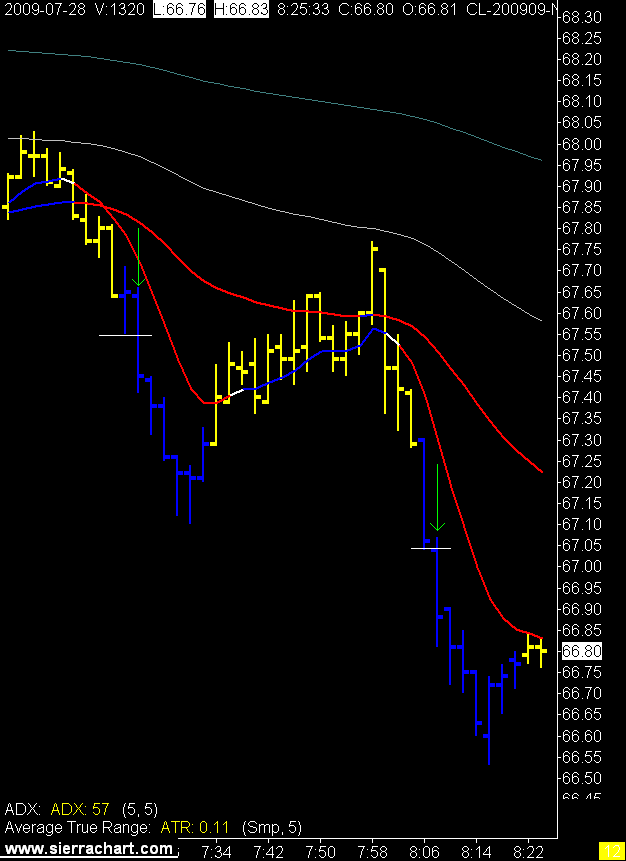
7/28/2009
Change
I did peek a little at charts while on holidays, which was a mistake, and found myself squinting at little charts on my laptop. This got me to thinking about getting the CL trading down to one chart instead of two.
I only use the one minute chart for soybeans but have found with crude oil I need to see trend and range on both the three and one minute charts in order to stay out of trouble. Besides having to watch two charts I have also found that when I see blue on one of the charts I want to hit the button rather than waiting for conformation from the second chart.
So being the quantitative genius that I am I added one minute to three minutes, divided by two and came up with a 2 minute chart.
Still playing with the ADX and ATR settings but found a couple of nice trades today. The trend was so strong this morning blind monkeys could have made money today. Only time will tell if the settings will keep me out of the flats and in the trends.
2 Minute Crude Oil Chart
Subscribe to:
Posts (Atom)