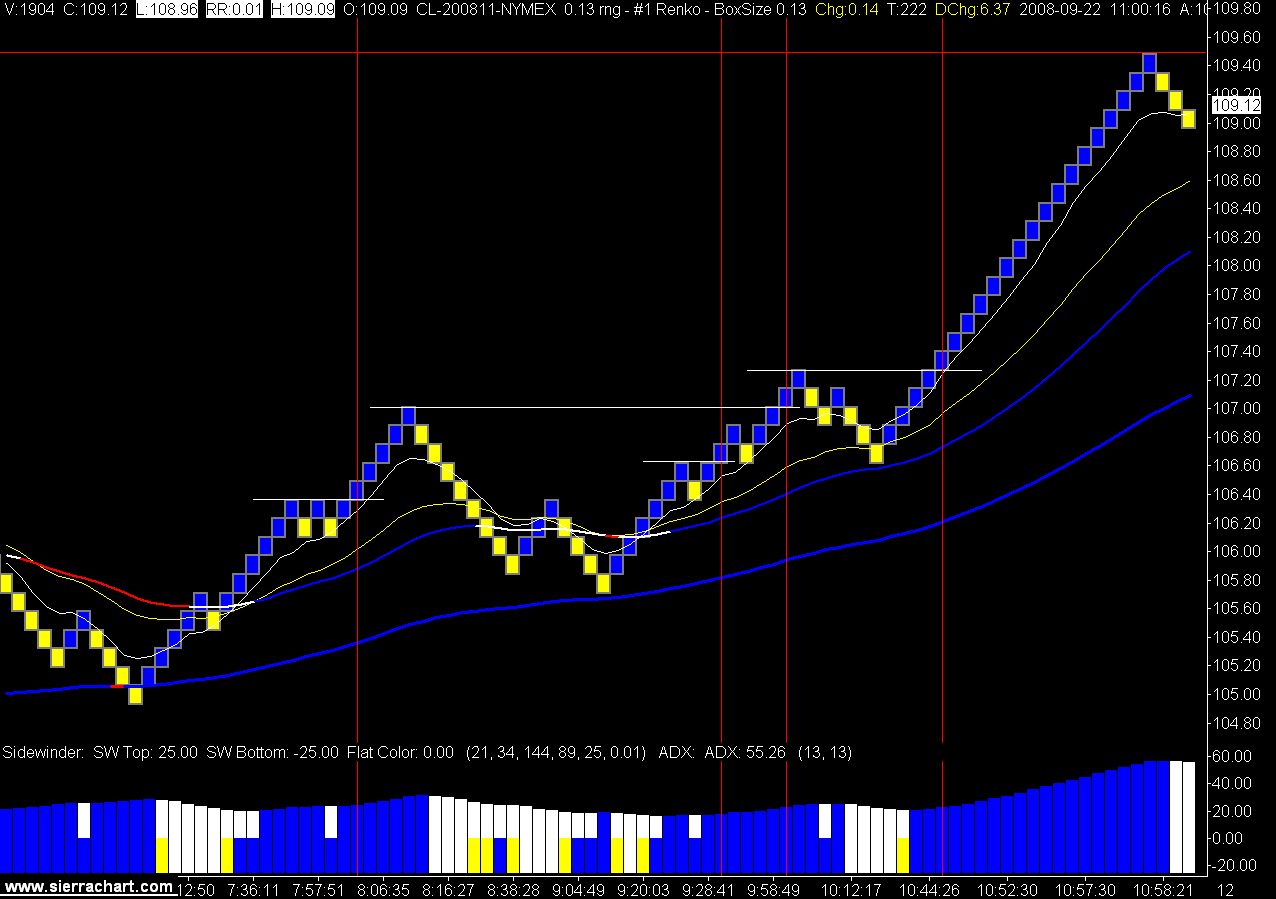
I wouldn't call the bull market until we see oil back up over the 3 EMAs ($117+ or so) on the daily chart. It has been quite a bounce since we saw oil in the $90s on the 16th of September.
The NYMEX October contract went limit up today, it was its last day of trading and had little volume as everyone was trading the November contract, so it really was not the benchmark to look at.
Today's trades on the 13 tick renko chart. Guess which one I didn't get filled on.
Isn't trading fun.
13 Tick Crude Oil Renko Bar Charts


No comments:
Post a Comment