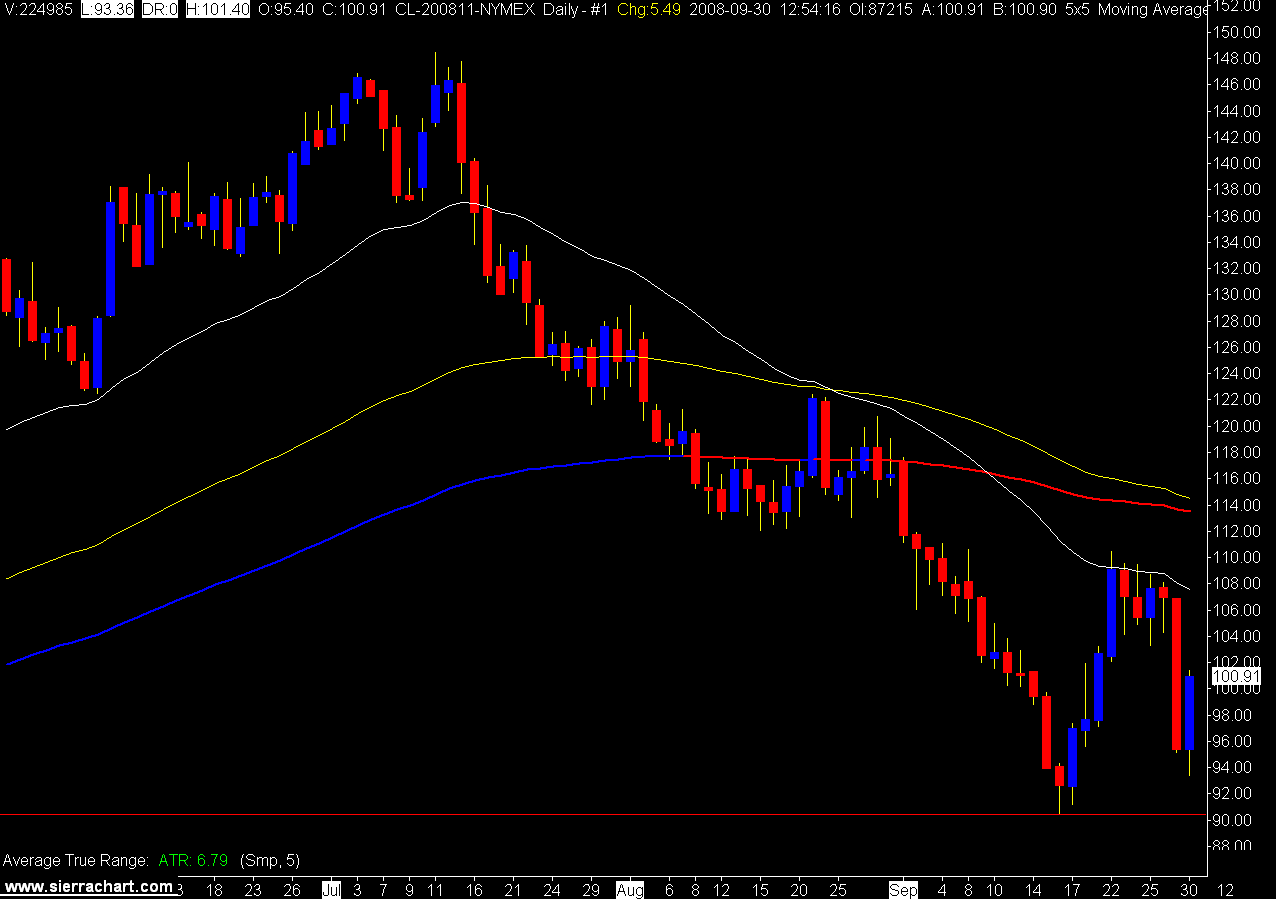
 The daily still looks like it is going to head south again, but I don't swing trade so I don't care.
 After we find out if Congress is going to do anything, we still have an American consumer with too much debt and American banks that are not going to be quite as willing to lend money.
Of course once the sub prime mortgage crisis settles down we can start on the credit card crisis.
All in all unless China and India can make up for the reduction in American crude oil demand I think oil is headed lower.
You would think that on a day like yesterday that saw crude oil move $10.00 +, a nice Norwegian, Danish, Swedish, English, Canadian could make some money trading it.
You would think that, but you would be wrong. Yesterday's stats, 1 win, 1 be, 3 losers, for 35 winning ticks / 42 losing ticks = RR .83.
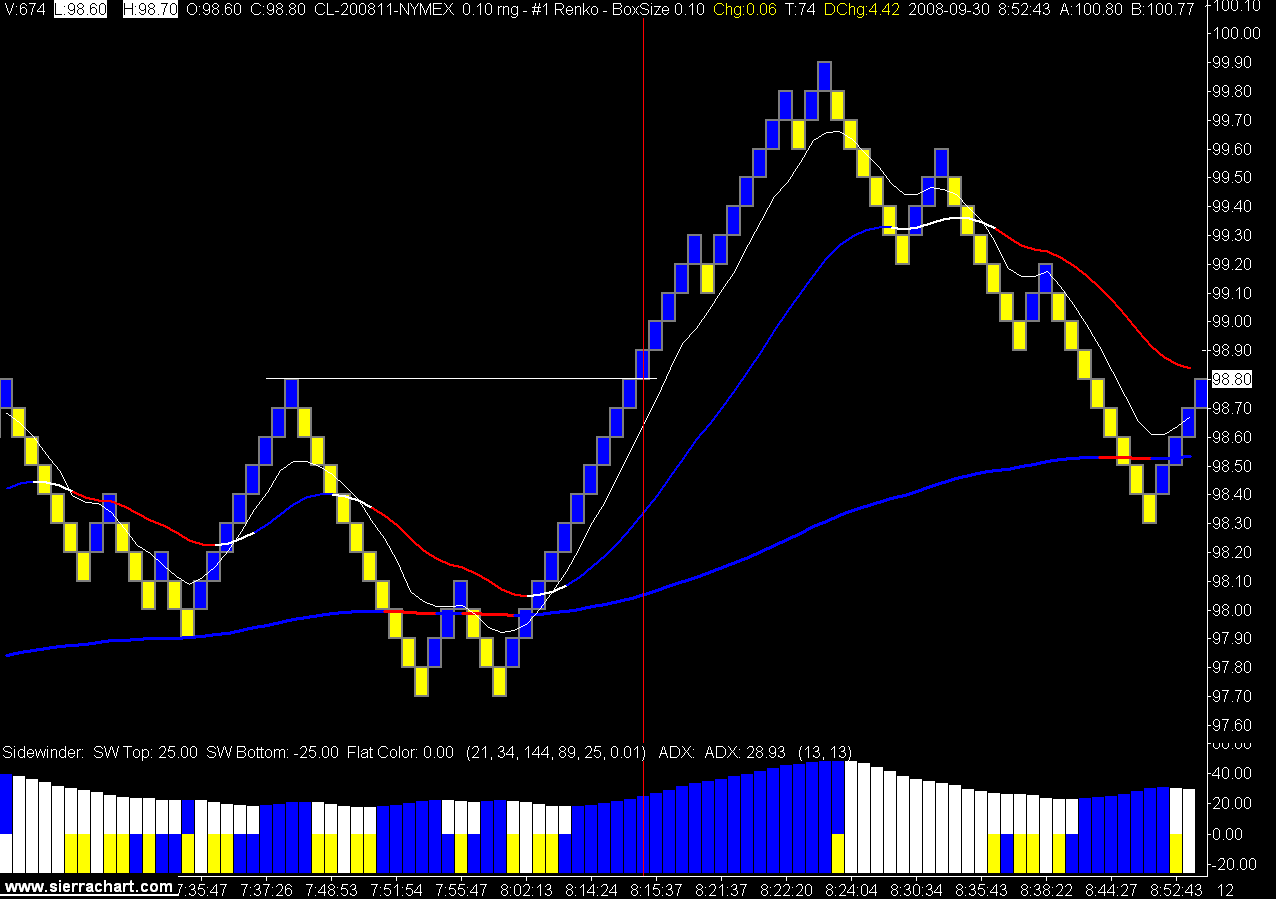
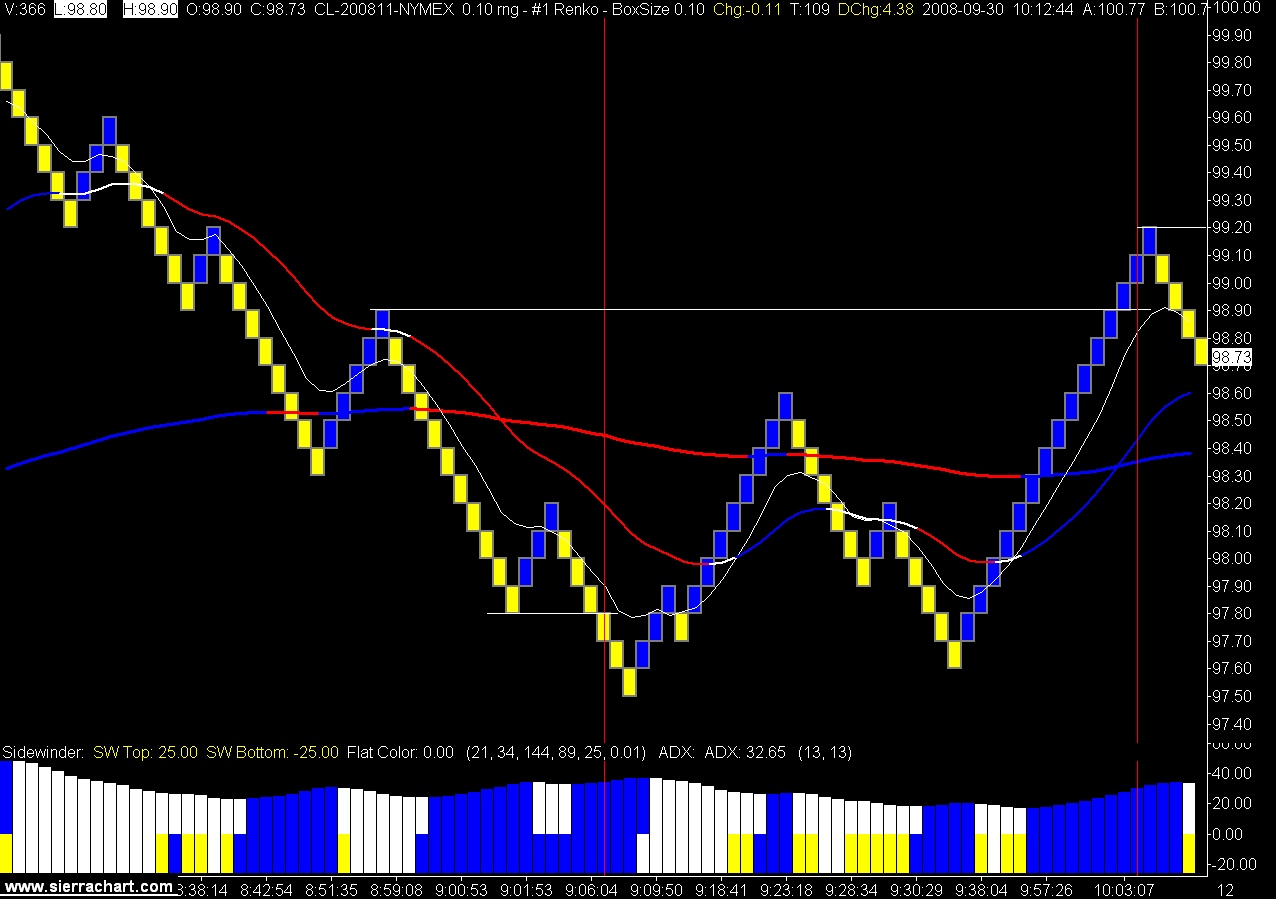
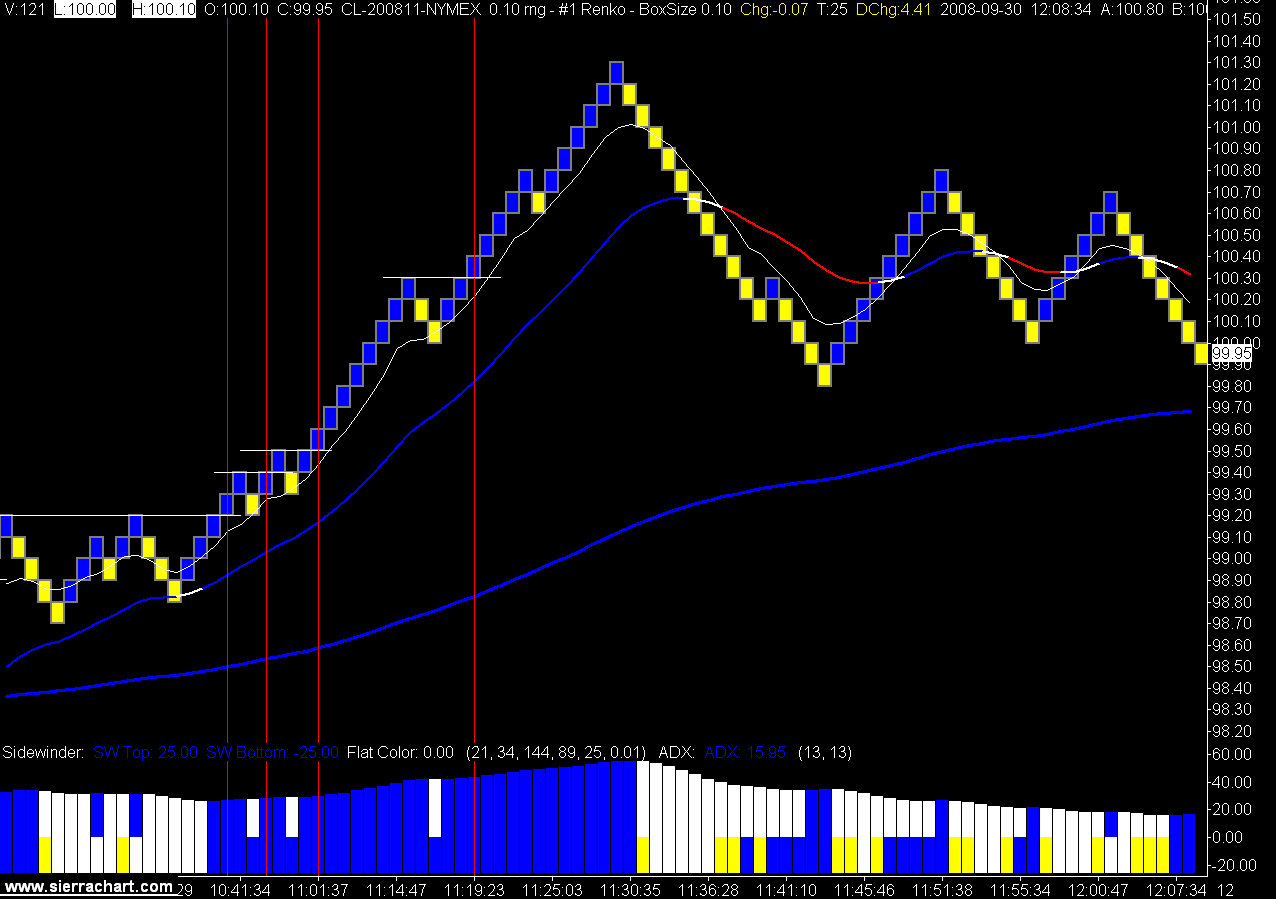
Today's much milder trade had 3 wins, 2 bes, 3 losers, for 108 winning ticks / 38 losing ticks = RR 2.84.
There are times when the trade simply becomes too volatile to trade with your "normal" time frame. The best chart to trade yesterday would have been the 15 minute chart. At least I recognized that my time frame was not working and quit trading early.
Today's more "normal" price action fits my trade template. One indicator you can use to recognize this is the Average True Range. I keep a 3 minute chart up with a 10 period ATR on for this purpose. You can also see it in the DOM, if price action is jumping all over the place you are either going to have to change your trade parameters or stay out of the market.
Today's trades


No comments:
Post a Comment