I only use the one minute chart for soybeans but have found with crude oil I need to see trend and range on both the three and one minute charts in order to stay out of trouble. Besides having to watch two charts I have also found that when I see blue on one of the charts I want to hit the button rather than waiting for conformation from the second chart.
So being the quantitative genius that I am I added one minute to three minutes, divided by two and came up with a 2 minute chart.
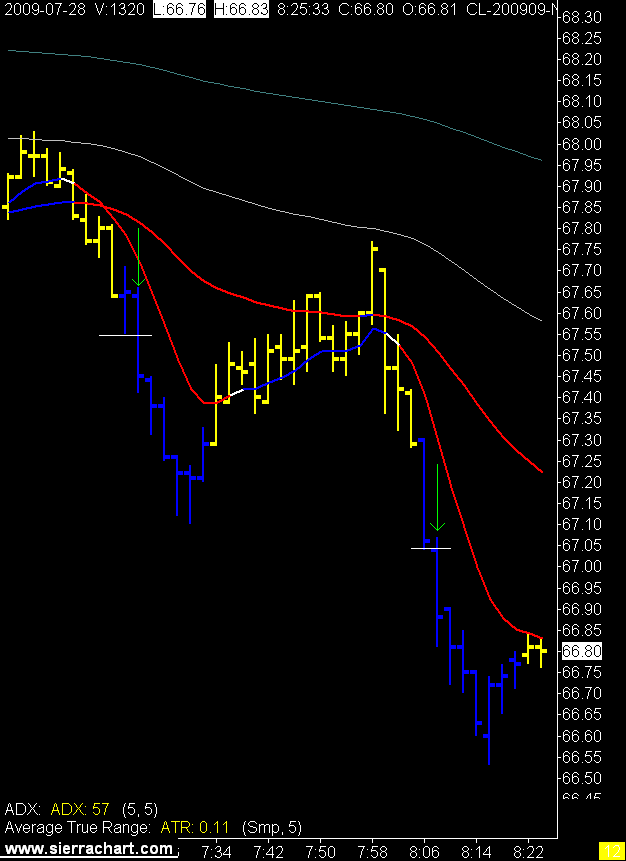
Still playing with the ADX and ATR settings but found a couple of nice trades today. The trend was so strong this morning blind monkeys could have made money today. Only time will tell if the settings will keep me out of the flats and in the trends.
2 Minute Crude Oil Chart
2 comments:
What triggers the color change with the bars? Indicator related?
Sierra allows you to "program" in an excel spreadsheet the parameters you want from your indicators with a price bar colour change or arrow showing it's time to trade.
For me thats the levels of the ADX and ATR, angle of an EMA, and price on the trade side of the EMAs.
http://tradingcrude.blogspot.com/2008/12/i-make-fire.html
Post a Comment