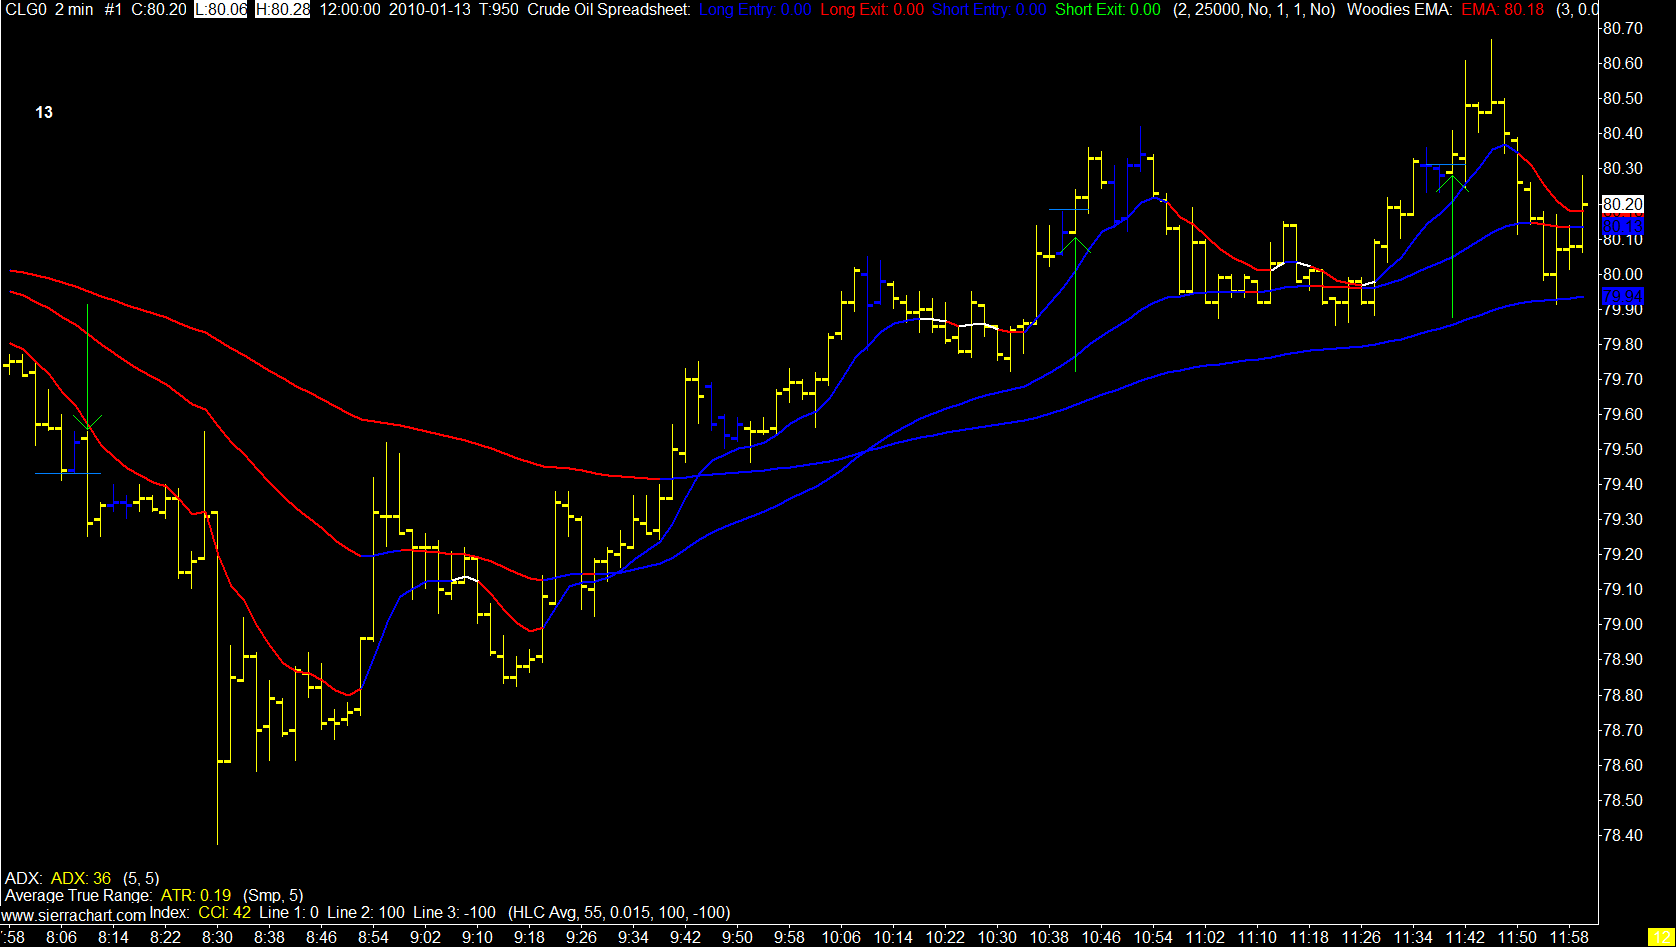
2 Minute Crude Oil Chart
Three trades today with the barrel count providing a catalyst. First trade caught my trailing stop for a net tick, second trade I bailed just before target as we were having a tough time getting through the HOD to get to target, and the third trade hit target.
There have been a few changes to the magic blue bars. You may notice there are not as many of them as before. That is due to some coding that drops the signal as price moves a certain distance away from the 8 EMA, and or the 3 EMAs spread gets to wide.
So if I get a signal bar and enter I want to see the blue bars disappear as that means price is moving my way fast.
I am also using a factor of the 5 day ATR for my target now.
Seems to make sense.
That 5 day ATR is still very low and any trading in this market is muted at best. Anybody who is relatively new to the crude oil pit should know that this is not the "normal" price action we usually see.
Hopefully we see the volatility pick up soon.

4 comments:
I like better this chart that has bigger time span, so it gives certain context, for us others no-system traders.
That's good.
I don't like the way it looks on the blog. But once you click on it you certainly get a better picture.
er...so now we like yellow bars?
We still like blue, then we like yellow.
We are very fussy.
Post a Comment