Showing posts with label trading crude oil. Show all posts

3/10/2010

Wednesday

Man with real job: So what do you do for a living?

Solfest: I work Wednesdays.

Man with real job: That's it?

Solfest: Yes.

Man with real job: So what do you do the rest of the week?

Solfest: I look forward to Wednesday.

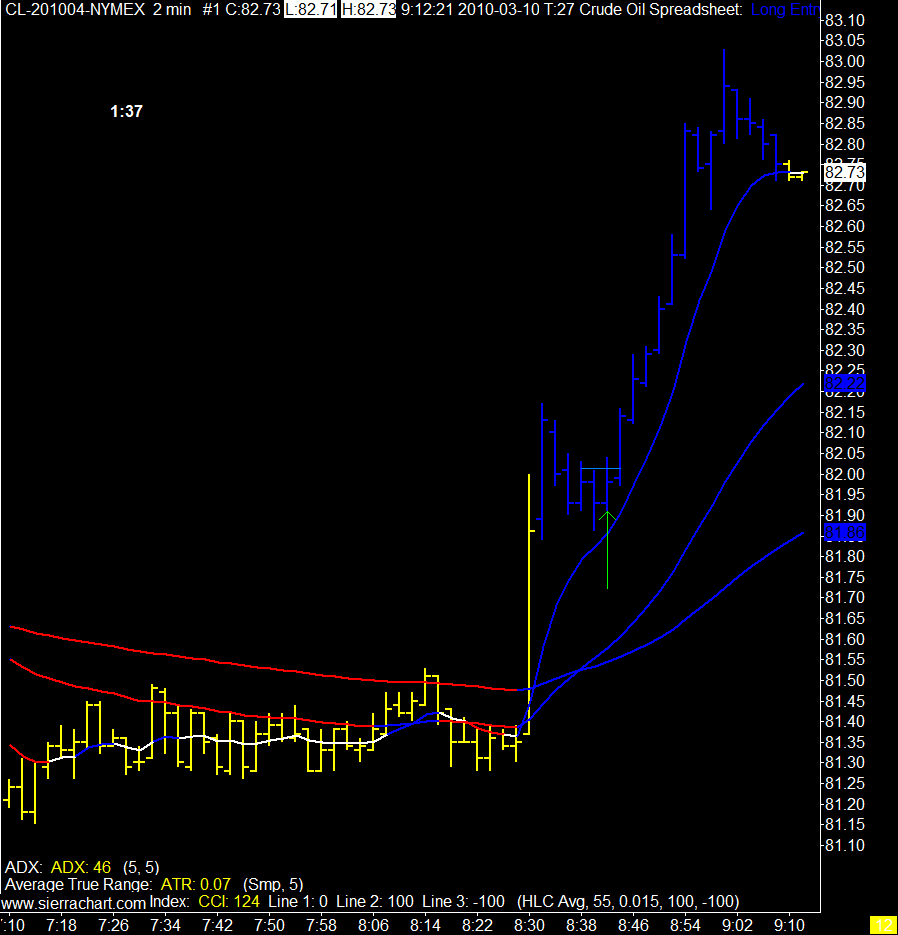
Crude Oil Chart

2/24/2010

Green is Gold

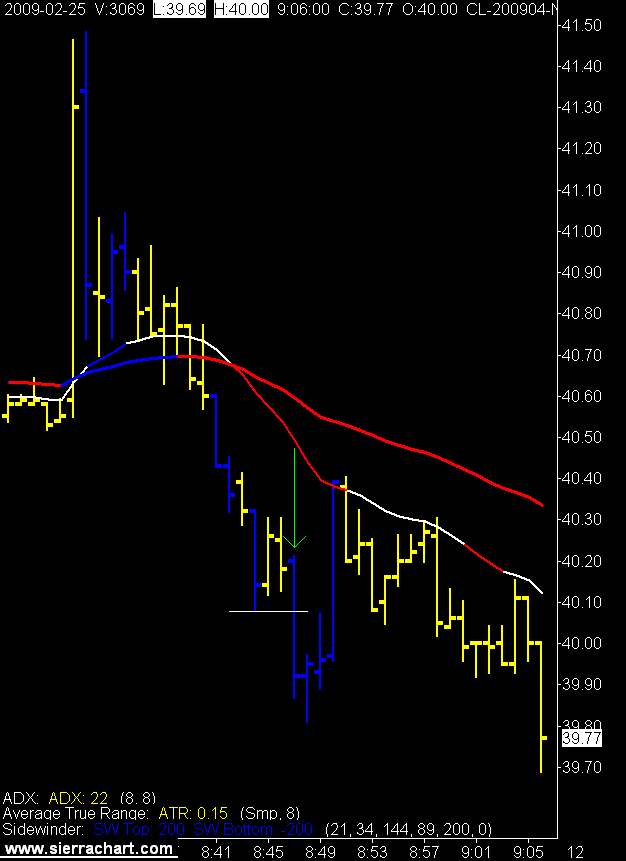
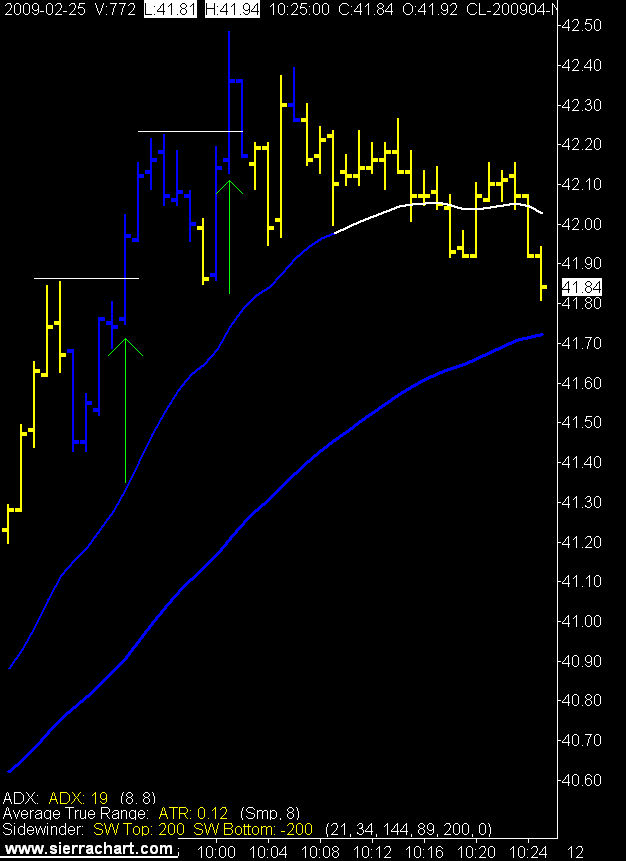
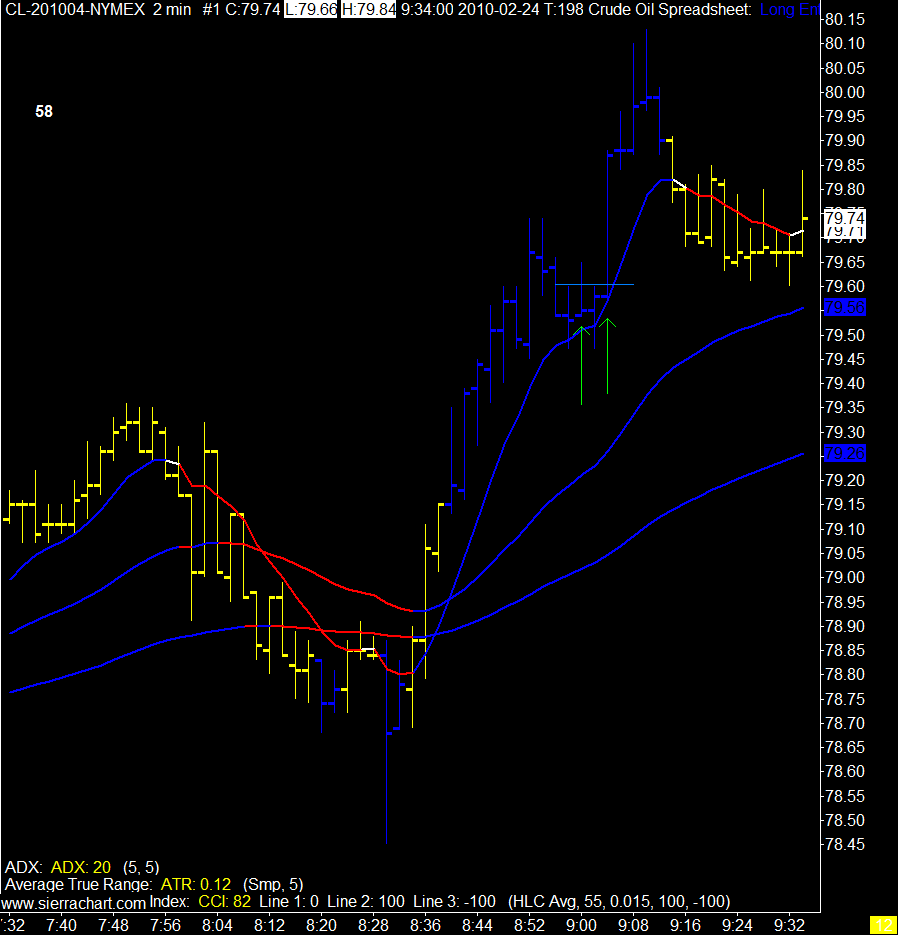
2 Minute Crude Oil
Let the first long go without me as I was waiting for the longer time frame charts to confirm. Stop wasn't big enough to stay in the first trade but caught the second for target.

That appears to be it for today.

11/12/2009

The Life of a Trade

I liked DT233's Why Trading Will Kill You post the other day so much I thought I would offer another selection along those lines.

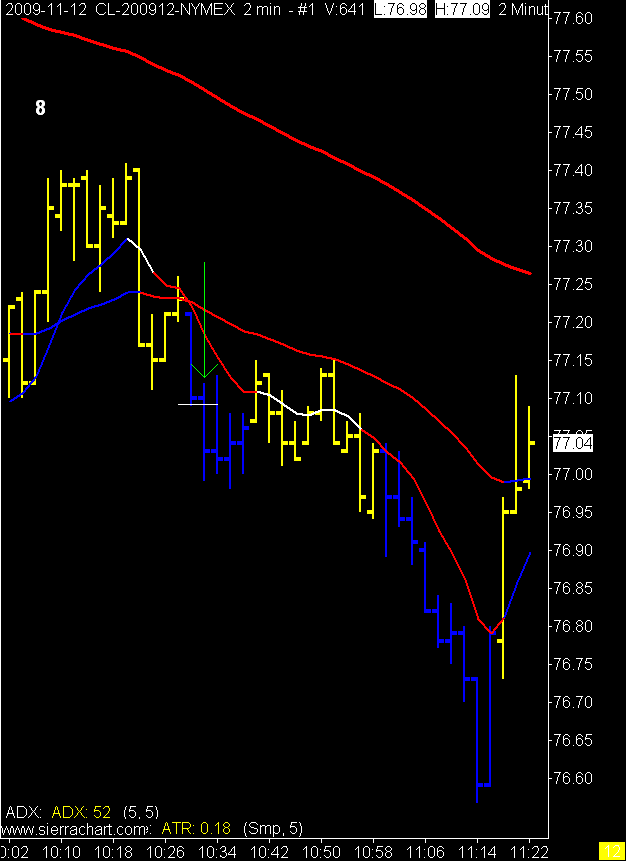
Maybe this is just because I finally had a trade that lasted long enough to actually tell a story about it, 45 minutes and 24 seconds. That may be a record for me.

Why so long in the trade?

I am no longer moving to break even at a certain point, instead I am trailing the stop at +8 from the hard stop of -13. I have found, albeit with a statistically insignificant number of trades, that I am staying in the trades longer.

I have moved my target up to 55 ticks as well, so this now means that I can have a -13, a +55, or any number in between -13 and +33 as my final result.

Now the real story on this trade was all those yellow bars after my blue bar entry. Ten of them, yuck. Did I want to check out with one of the many passes through my entry point?

Yes.

Would that have been an ok thing to do after 20 plus minutes in a trade that's going nowhere?

Probably.

Why didn't I?

I talked to myself.

I talked through the trade, yes my short ema was flat and getting breached, however my trailing stop had moved down 2 ticks to -11 so risk had been reduced a little.

That stop was still sitting above the middle ema, so I asked myself why do you have that middle ema on your chart?

Well it's supposed to tell me where trend is at on a longer time frame basis.

Right, so that trend is still what?

Short.

Right, so why not let it ride and see if momentum comes back your way?

Why not, I'll tell you why not a -$115.50 dollar result is why not.

Why not bail out at +-1 or 2 and wait for the next signal?

Hmmm.

Well, the move is slow...

Slow, it's non existent! (I'm now interrupting myself in this conversation)

Ok it's non existent but you had a valid signal, you have set your risk management parameters for a reason, why not let those parameters play out?

Fine.

But if this doesn't work I'm holding you responsible.

Fine.

Ok I'm done talking to myself now.

As you can see it finally went. Now the next emotion racking event was the MFE, 55 you say? Not quite, 52. LOL

Trade stats were, short entry 10:32:01 MST at $77.08, MAE -0.08, MFE +0.52, exit 11:17:26 MST at $76.77.

Yes 3 ticks away from target and it turned back to the trailing stop. A +31 result. Still very good.

So if there is a moral to the story it is this, we all have emotional responses in this business, no not just DT233, we all second guess, micromanage, and if it works in our favour we are genius, and if it doesn't, well you know.

Message to us all.

Let the probabilities work.

If you have a statistical data base don't corrupt it with your emotional in flight responses.

Trade like Captain Sullenberger; we're going into the Hudson, brace for impact, we've arrived, I hope you all enjoyed your flight.
9/29/2009

An Epiphany

I haven't been the Swamiguru for a while so I know you are all desperate for some Swamiguru wisdom.

Every Swamiguru needs a mantra, a hook so to speak. GB007 has his "the urge to trade is greater than the urge to trade profitably". That's a good one.

So now I have come up with mine, feel free to quote me amongst your friends, oh right you're traders, friend.

Ok here it is, the market decides how much money you make, you decide how much money you lose.

The Swamiguru has spoken.

2 Minute Crude Oil Chart

6/26/2009

Patience

"Patience (pā-shəns) is the state of endurance under difficult circumstances, which can mean persevering in the face of delay or provocation without becoming annoyed or upset; or exhibiting forbearance when under strain, especially when faced with longer-term difficulties. It is also used to refer to the character trait of being steadfast.

In evolutionary psychology and in cognitive neuroscience, patience is studied as a decision-making problem, involving the choice of either a small reward in a short span of time, or a more valuable reward after a long period of time. All animals, humans included, discount future rewards—the present value of delayed rewards is viewed as less than the value of immediate rewards.

In a 2005 study involving common marmosets and cottontop tamarins, both species faced a self-control paradigm in which individuals chose between taking an immediate small reward and waiting a variable amount of time for a large reward. Under these conditions, marmosets waited significantly longer for food than tamarins. This difference cannot be explained by life history, social behaviour or brain size. It can, however, be explained by feeding ecology: marmosets rely on gum, a food product acquired by waiting for exudate to flow from trees, whereas tamarins feed on insects, a food product requiring impulsive action. Foraging ecology, therefore, may provide a selective pressure for the evolution of self-control.

Patience is often described as a core virtue in religion or spiritual practices. For example, Job is a figure that appears in the Hebrew Bible, Christian Bible and the Qur'an; his story is considered a profound religious work. At its core, the theme is the co-existence of evil and God and the application of patience is highlighted as the antidote to the earthly struggles caused by that co-existence. The plot of the book is that Job endures near-apocalyptic calamities without losing his patience or reproaching Divine Providence. In the Qur'an, the person of Job is actually known as Ayyūb (Arabic: أيوب ), which is a name that is symbolic of the virtue of patience (although it does not mean patience in itself)." Source Wikipedia

Hmmmmm.

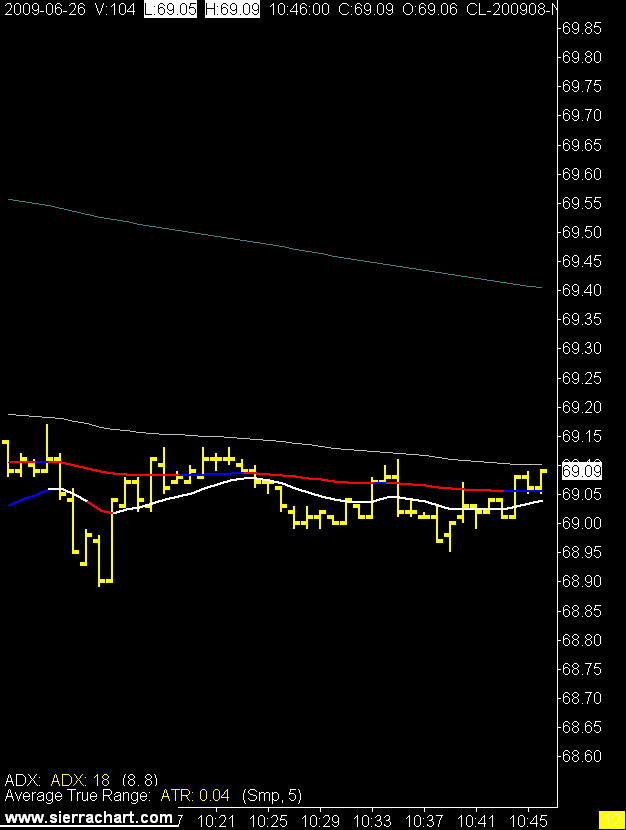
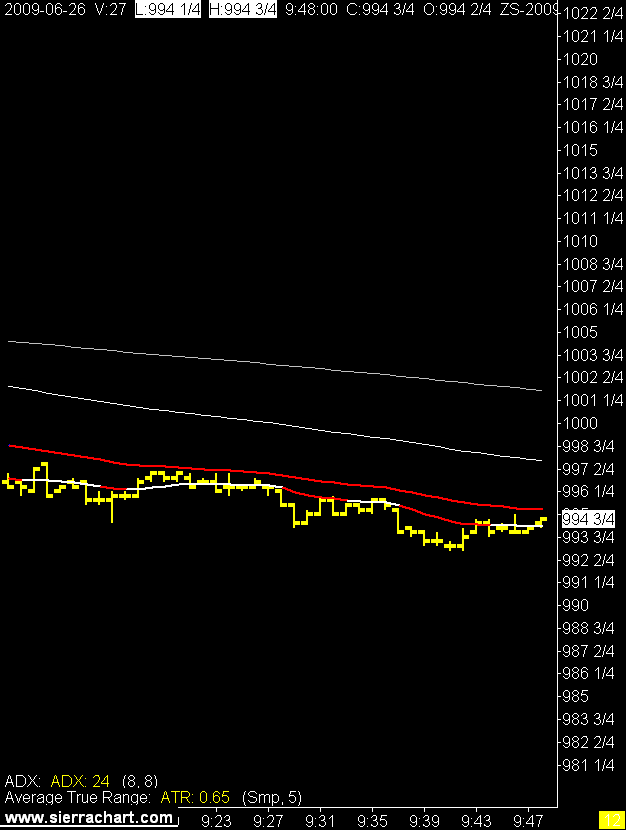
Charts with no trades. Or should I say no signals.

Hmmmmm.

Crude Oil
Soybeans

2/27/2009

Doing Time

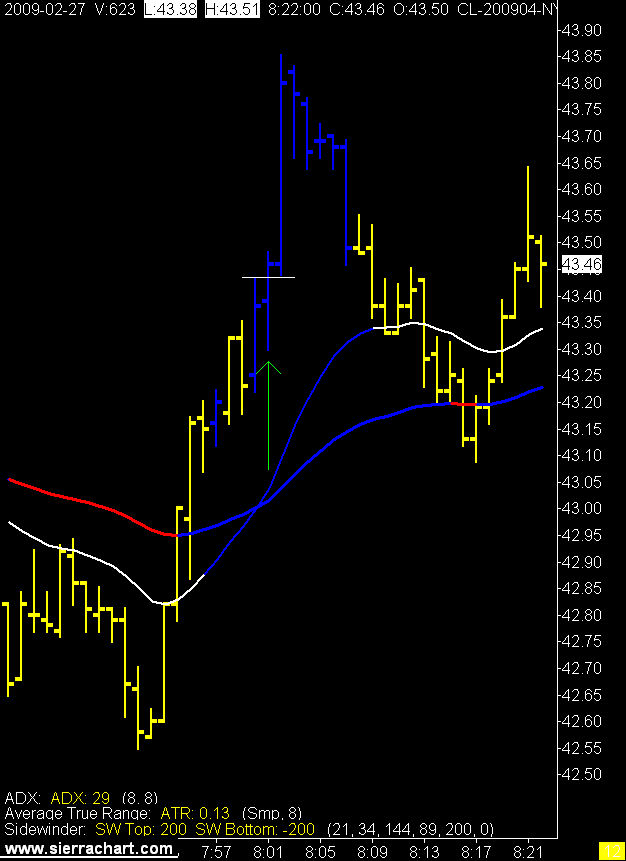
Let's see, five and a half hours in the crude oil session. That's 19,800 seconds. I had one trade that lasted for 67 seconds. I stare at charts for 19,800 seconds so I can trade 0.34% of the trading day.

Strange job.

At least I got paid.

5 Minute Crude Oil Chart

1 Minute Crude Oil Chart


Interesting story from the Globe and Mail on Albertans working in Iraq.

2/25/2009

A Slight Tweaking

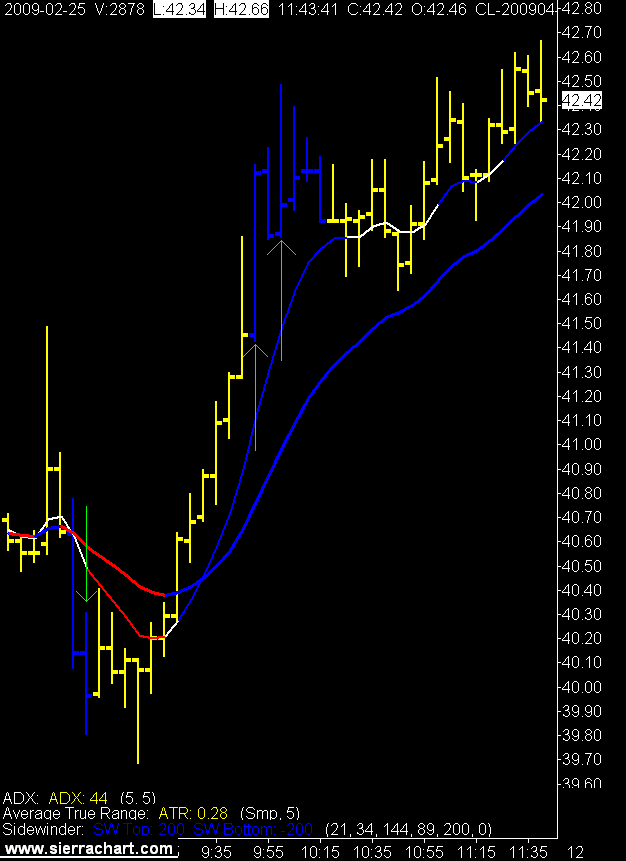
I have made a few slight adjustments to the magic blue bars as I have been suffering a major lack of magic these last few weeks. The parameters for the indicators are roughly the same but I have shortened the length required to obtain those parameters.

For example the 5 minute ATR and ADX are now a 5 period instead of an 8 period.

Barrel count today and you see the crazy price action on the 1 minute chart at 8:30 MST. That kind of price action is tame compared to how it used to act, back in the good old days.

I missed the first trade and caught the next 2, one for full target and one partial.

5 Minute Crude Oil Chart

1 Minute Crude Oil Charts

2/20/2009

Another Long Day

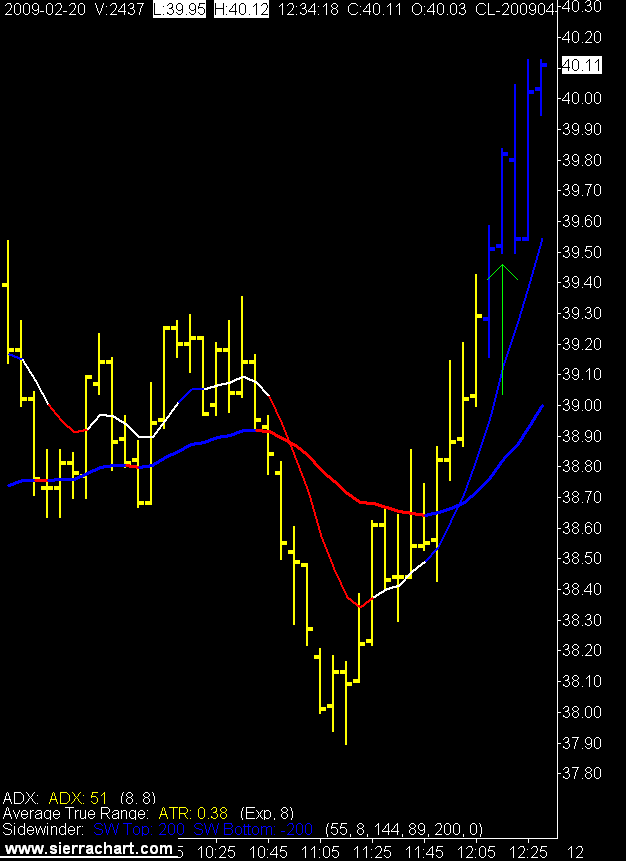
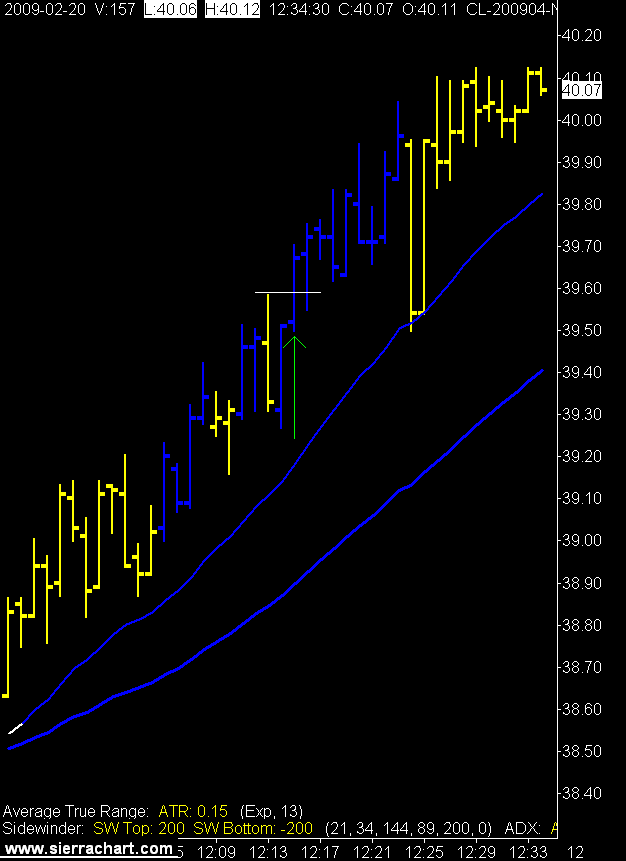
One signal two trades. :)

The non signal trade was blue on the 1 minute but not on the 5 minute. You have my sincere apologies. The signal trade was a slow one and came within 3 tics of target. Trailing stop exit.

Yes indeed, a rather long day for little reward.

I wonder what blue bars look like on a gold chart?

5 Minute Crude Oil Chart

1 Minute Crude Oil Chart

Some good video on the old blog this week. Have a nice weekend and give them a watch.

2/10/2009

Super Genius

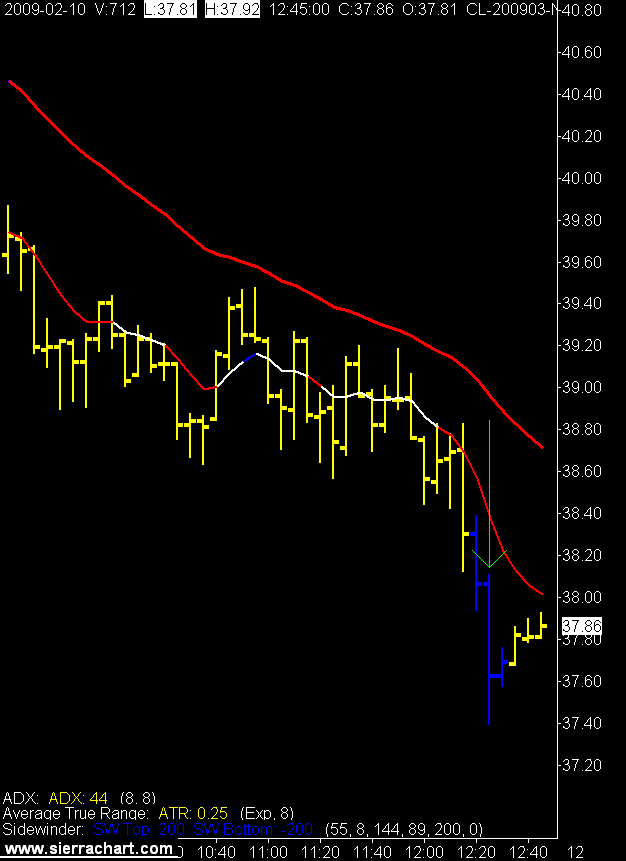
Some days you can research, plan, execute your plan, think happy thoughts, and you still don't catch the road runner. Timothy Geithner's plan had the same kind of day.


5 Minute Crude Oil Chart

1 Minute Crude Oil Chart

1/30/2009

Saved by the Bell

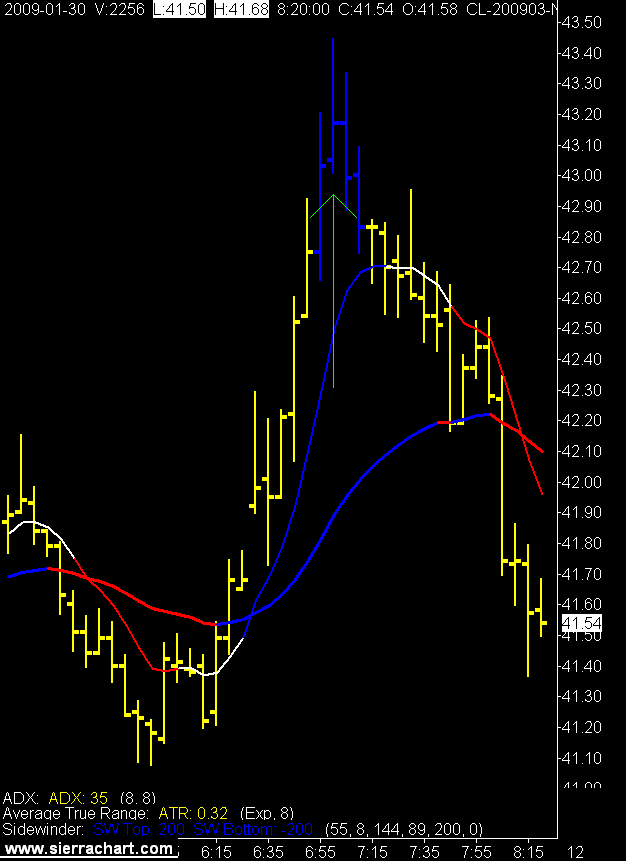
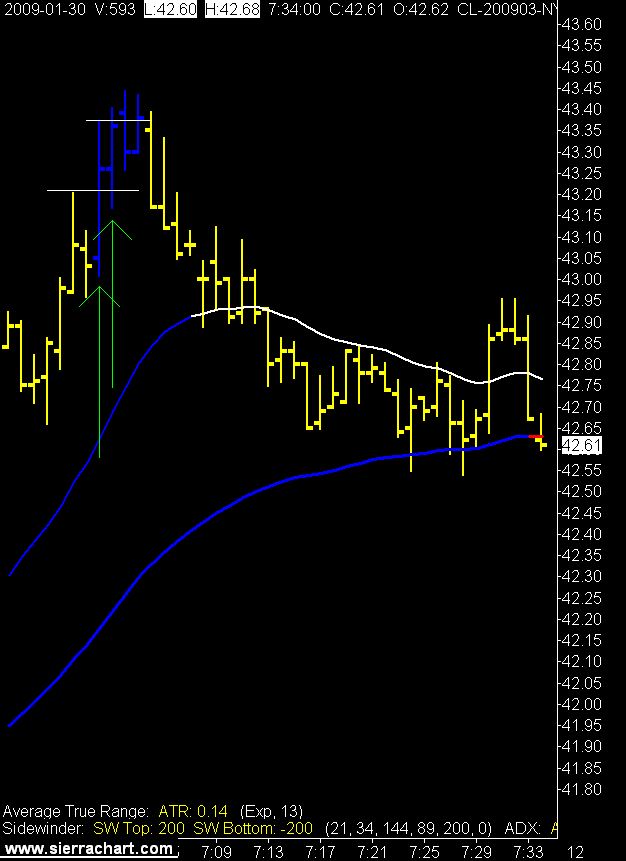
The week was a giant bore. The best thing about it is, it's over. Five day ATR for crude is 340 tics which is very low. I guess you have to factor in that this is a 41 dollar contract now, not a 140 dollar one.

I'm happy with the inherent risk management in the "blue bars" as adding range to the trend equation has kept me flat for most of the week.

Flat was the correct position.

We shall see what next week brings.

Two swings at the CL today for a net result of -8 tics.

5 Minute Crude Oil Chart

1 Minute Crude Oil Chart

6/19/2008

Oil Speculators Drive Down Crude Oil Price

I couldn't resist.

My theory that the main reason for the price of crude oil is the threat to supply due to the conflict in the Middle East saw the reverse side of the equation play out today.

A threat to demand.

China announced that they are raising the price of gas, with the thought being the higher price would drive down demand.

Crude oil can go down.

China controls the price of energy by subsidizing their refiners who have to pay the world's market price for crude oil, refine it into gasoline, and then sell it at the Chinese government's dictated price.

This is costing the Chinese government billions of dollars and artificially inflates demand for energy as the real cost is not seen in the Chinese market place.

All in all it made for a great trading day in the crude oil market.

13 Tick Range Bar Charts (click to view)

6/18/2008

If at first you don't suceed

Barrel counting day is usually a great day to trade crude oil. I had no trades before the news and waited for the market to settle down a little after the 8:35 MST U.S. Department of Energy oil inventory report.

The news was fairly benign and the market did not launch one way or another to any great degree. I started getting signals and initiated a couple of trades that were stopped out quickly. Between 8:45 and 9:21 I had 5 trades, 4 stop outs and 1 break even.

What to do?

I may have mumbled some bad things, shut down the charts, and then went and bought a coffee.

With some sober second thought made a decision to wait until after the New York lunch hour and then come back to the market and see what happens.

So the first chart below shows the action around the first 5 trades and the second chart shows the action around the next 7.

Needless to say the trading went a lot better in the my "after coffee" trading session.

While I did turn a losing day into a winner I could have also just added to the losses. The key was to STOP for a while, clear my head, and come back to the market without the revenge trading attitude.

Trading is hard.

Click on chart to view

After coffee trading

6/11/2008

Dual Time Frame Trading

Some questions on the 2 time frame trading I was talking about yesterday arose. So I will post some entries showing the bar that I entered on the 34 tick range bar chart and the actual entry bar on the 13 tick range bar chart.

I had 11 trades today and a couple of orders that didn't get filled, so it was a busy day. I don't want to (and you don't want me to) post 22 charts so I will post a winner, and a loser.

Again, I want to see the signal triggered on the 34 chart first then look to the 13 chart to find an entry point.

One of the no fills I had was on the big run up you see on the 34 chart. I missed the huge move, then got stopped as I finally got in, then caught a winner at the very top of the move.

Crazy trading.

34 Tick Range Bar Chart (click on charts to view)

13 Tick Range Bar Chart

13 Tick Range Bar Chart

6/06/2008

Crude Oil Explodes

Wow.

A confluence of events drove crude oil to new all times highs today.

The U.S. jobs report, a Morgan Stanley crude oil prediction, and Israel sabre ratting with Iran took the July NYMEX crude oil contract to an intra day high of $139.01.

Daily Crude Oil Chart (click on chart to view)

The trading today offered plenty of opportunities. You always look back on the day and think you should have carved more out. I stopped trading after the 5 minute trading halt happened as I was not sure if there would be another one instituted.

I, and I'm sure a few other traders, brushed up on the CL trading limits today.

Maximum Daily Price Fluctuation

"$10.00 per barrel ($10,000 per contract) for all months. If any contract is traded, bid, or offered at the limit for five minutes, trading is halted for five minutes. When trading resumes, the limit is expanded by $10.00 per barrel in either direction. If another halt were triggered, the market would continue to be expanded by $10.00 per barrel in either direction after each successive five-minute trading halt. There will be no maximum price fluctuation limits during any one trading session." Source: NYMEX Web Site

I caught 3 good moves, a few small stops, and a few no fills due to the speed of the market.

All in all a good day.

5/21/2008

Crude Oil Trades Over $133

I have run out of adjectives to describe crude oil prices. Lets just say they went up.

There were several opportunities to get long today, I got in on the first move up and then passed on the rest of the signals. The signals after winning trade did not provide much of anything until the last 10 minutes of the NYMEX floor session.

Does that mean I was smart not to take them?

No.

The fear and greed complex in trading is always at work, even when a trader has a nice profit. Instead of using the greed side and trading all the signals as I should of, I let the fear side enter in and say "no more trades".

With money in the bank you can justify this position, but, when the signals are not working and the losers start to stack up guess what happens?

The greed factor kicks in and says "keep trading, you'll get it back".

Wrong.

This is when you need the fear factor to make you stop. No more losers.

That is the rational for the trader needing to reverse the human fear and greed instincts in order to have any success in this business.

The inability to do so is the key theme for trading failure.

Trading is not about systems, it is not about indicators, it is all about money management and the battle inside your head.

Don't enter the war until you have properly equipped the army.

34 Tick Range Bar Chart (click on chart to view)

13 Tick Range Bar Chart

5/07/2008

More Oil, Higher Price?

The U.S. Department of Energy's petroleum report came out today showing crude oil inventories rising.

The crude oil response was to move up to its highest price ever, over $123 a barrel.

The efficient market theory is a wonderful thing as long as you remove humans from the equation.

While this is all fascinating it didn't affect my trading today. The report usually provides more range to the crude oil contract and while today's response was fairly muted there were still a couple of good trading opportunities.

I'm showing the 2 charts I watch throughout the day, the 34 and 13 tick range bar charts. I am looking for confirmation on both charts to trigger a trade.

The first trade wound up with a break even stop, the second was a nice winner with the ADX turning white as the exit.

You will also note I missed a nice move at 8:55, I wasn't paying attention and by the time I noticed it was moving so fast I passed rather than try and jump in late.

It happens.

34 tick chart.

13 tick chart.

13 tick chart.

5/01/2008

Trade the Plan

How do you have a $500.00 winning crude oil trade and feel like an idiot?

By not following your plan and missing the $930.00 that came after your brilliant exit.

The trader in charge (me) was watching the 8 EMA and the CCI 100 line cross and came to conclusion that he should move his stop to protect profit.

The ADX, who is not in charge, said there could be some more downside here, lets hang on until I turn white. Which is how the trading plan is written based on hundreds of trades showing that this is the best exit.

I don't mind leaving money on the table when it happens within the confines of the trading plan, but when I deviate from the plan and it costs me money... well let's just say I was not happy.

The plan and the ADX were right.

The trader in charge (me) was wrong.

Trade the Plan.


(click on chart for better view)

4/24/2008

Crude Oil on Sale?

The eternal question, how high will it go, just won't go away. That along with the blank stares when I tell them I don't know are starting to annoy me. So I will step out and say this may be it for a while.

So there it is my prediction, which I will stand by until it goes higher. :)

The downdrafts on crude oil today were quick and violent. There seemed to be a hint of panic selling at times today. If the street's money flow starts to move out of crude oil the reversal will be interesting.

Oh and by the way, I still don't care where the price of crude oil goes.


4/18/2008

If You Can't Beat Them.....

The talking heads say crude oil prices are being driven by speculators, if that is the case then it is going to be a violent drop when the speculators leave, or turn short. For now there appears to be no limit to the upside.

Entry points for today 04/18/2008 NYMEX Light Sweet Crude Oil June Contract
(click on chart for better view and click again when chart opens for larger view)

4/17/2008

Fortune

I think Fortune magazine has the most talented editorial staff in the business field. They have been doing some great work following the recent wall street "issues".

Pick up a copy or have a look online.

http://money.cnn.com/2008/03/28/magazines/fortune/boyd_bear.fortune/index.htm

http://money.cnn.com/2008/04/03/news/companies/2boutthedoor.fortune/index.htm

http://money.cnn.com/2008/03/31/news/economy/gelman_taleb.fortune/index.htm

You can click on the Fortune title to go to their home page.