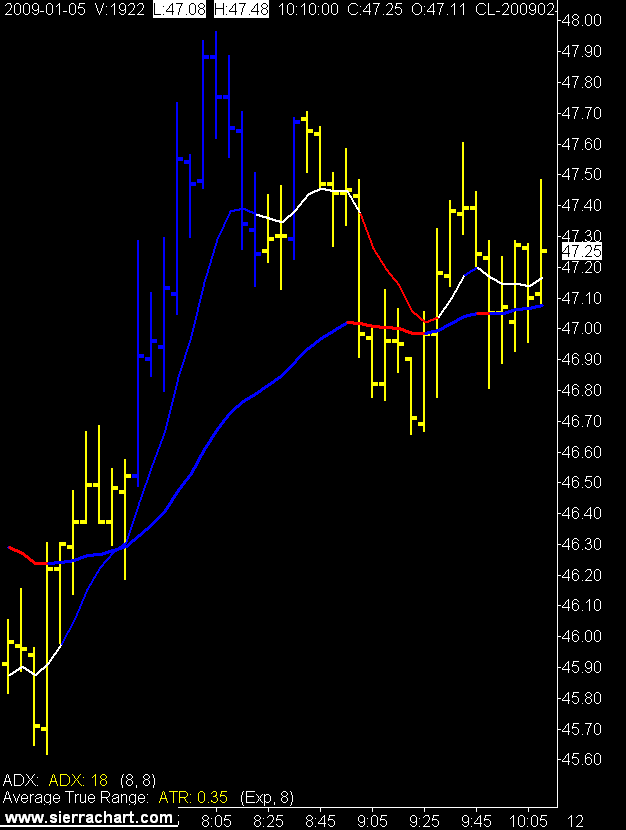
Didn't look at the YM until the end of the day and there were no signals.
The 5 day average true range on the YM is 220 tics and the CL's is 503 tics.
So, I don't think it takes a trading genius to figure out that it's a whole lot easier to snag a few tics out of the CL's day as opposed to the YM's day.
Crude had 2 nice trades in the morning that I caught and one at the end of the session that I did not.
I find I am not looking at the renko chart as much as I used to. I am concentrating
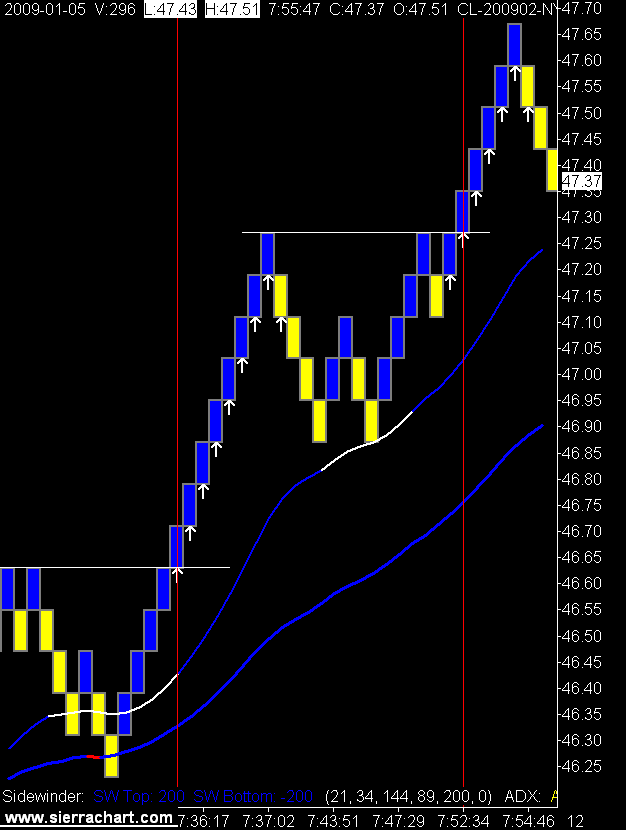
(concentrating may be overstating it says the man who loves rain) more on the minute charts instead. Once a market really gets moving the renko will show an entry quicker than waiting for a minute bar to close. Maybe then they will still have some value for me.
Right now the markets are not moving quickly.
Could also be that the renko chart only has magic white arrows, which when compared to the magic blue bars are rather passé.
5 Minute Crude Oil Chart

1 Minute Crude Oil Chart

8 Tic Renko Crude Oil Chart

5 comments:
I see that you entered at around 46.85.. where do u keep your stop at.. how about your exits.. are you first determining a trend and then finding higher highs/lows on the 1 min chart determining your trades. Just find your site intersting and trying to make some more money learning from you.
Trades marked for you Pranil.
Exit is a 36 tic target. Both of these trades hit target.
Pranil, stop is currently 11 tics, it moves to be +1 at 12 tics MFE, trailing stop starts at 21 tics, and target as I said is currently 36 tics.
And as always remember this:
http://tradingcrude.blogspot.com/2008/04/how-to-trade.html
Redundant because you still have too many indicators saying the same thing.On renko chart delete all lower pannels, delete the 2 MAs then you will have just what you need.
Alrighty then.
Renko renko and more renko.
Post a Comment