I doubt I would have taken those last two trades live as the floor trading was about to close and we quite often see some strange price action in the last 15 minutes or so. That said the signals were there so I simmed them and they go into the stats.
Crazy day.
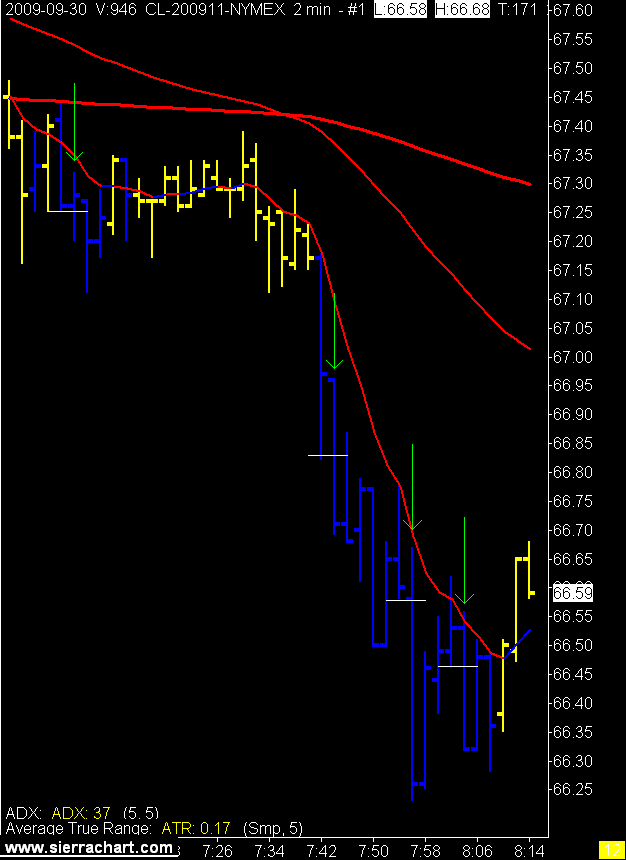
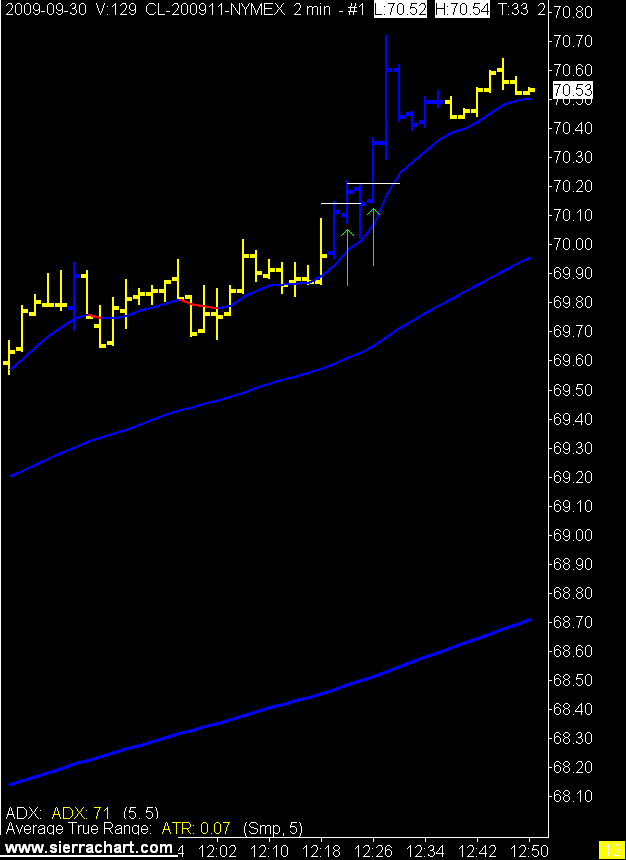
2 Minute Crude Oil Charts


4 comments:
14 trades Sol? Is that normal for you? Or were you "in the zone"?
No that's not normal, the average is 5.
The signals just kept coming.
Look at a 15 minute chart, the day was straight up after the report. When the trend doesnt change for most of the day the number of signals goes up.
If the trend keeps changing I don't get signals as I have to wait for the 8 EMA to crossover, and sometimes the ADX goes flat in the changeover, etc.
15 Minute CL
http://www.sierrachart.com/userimages/upload_2/1254340210_80_UploadImage.png
60 Minute CL
http://www.sierrachart.com/userimages/upload_2/1254340197_32_UploadImage.png
Crude was a monster today. You rode it well. Adrenaline is pumping just looking at your charts. Nice trading.
Post a Comment