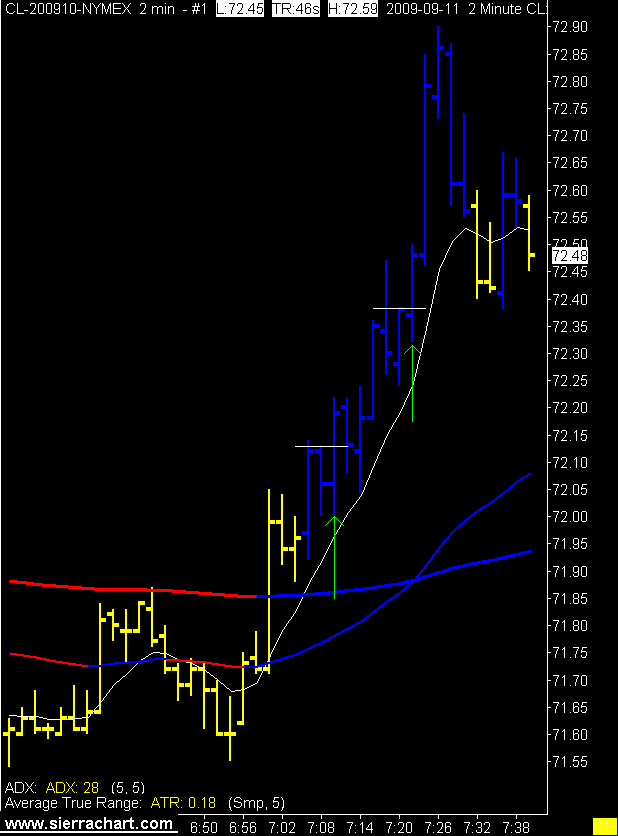
 I moved the stop to break even + 1 a little early on the first signal and that's what I got. It then ran to target of course. Fortunately I got a second chance and behaved myself as it hit my target.
This machine is running vista so things look a little different. I had to program sierra again as I had not updated it as per the settings on my regular trading computer. I dropped one EMA as it seemed redundant. Hopefully the other comp gets back into service today as I can only run one monitor with this one.
9 comments:
Finally. Thank goodness! A chart.
What's it been? A month? Two?
:-)
Ya Ya Ya.
Hey now you are one to talk Mr Post once a decade. :)
HA! I'm working on some new material.
"Buy low, sell high" kinda stuff. People eat that up! Oh yeah, gonna have more charts too. LOL
Buy low, sell high? Huh? I'm intrigued -- please elaborate.
Oh, JE, I can't reveal my secrets. But I can add that I'm currently testing a "Buy high, Sell higher/Sell low,Buy lower" strategy. It may shake the trading world!
Btw Sol, the reason why I stopped in again today...
Do you use an R-multiple for your profit target?
DT yes, 3 times the stop. For those unfamiliar with R multiples your stop is 1R. So target is 3R.
And the magic to let me know when that probability exists......
ATR.
DT233 -- touche! :-)
Solfest -- This crude oil stuff is a wild beast. My goodness. It nearly chewed off all four of my limbs today. Yowza!
JE you seemed to have tamed the beast rather nicely.
Post a Comment