Then I started to fiddle with some charts. No problem we traders always fiddle with charts, nothing major, brought up a 15 minute chart to look at this huge downtrend we were in, yep it's a huge downtrend, not sure why I needed the 15 minute to see that.
I have had a tick chart up for the past few days with my 2 minute chart study on it and have been tracking the results of my 2 minute trades with and without agreement on the tick chart. As I brought up the new 15 minute chart I must have re arranged the order on the monitor. I always have the chart I'm trading on the right hand side of the monitor so it is next to the DOM on the left hand side of the other monitor.
Somehow the tick chart wound up on the right hand side. I took the next 2 signals for full stops thinking I was seeing them on the 2 minute chart. Was also thinking I'm on to something here as there was no congruence on what I thought was the tick chart.
So in fact what your humble scribe (can't call myself a trader today) was doing was taking signals off the tick chart and looking for congruence on the 2 minute chart. Exactly the opposite of what I'm supposed to be doing.
Oops.
Let's just keep this between ourselves.
Thanks.
Now the 15 minute chart is back in the bin, the 2 minute chart is back on the right hand side of the monitor, and I promise to leave well enough alone.
You can't see if my fingers were crossed when I promised that though.
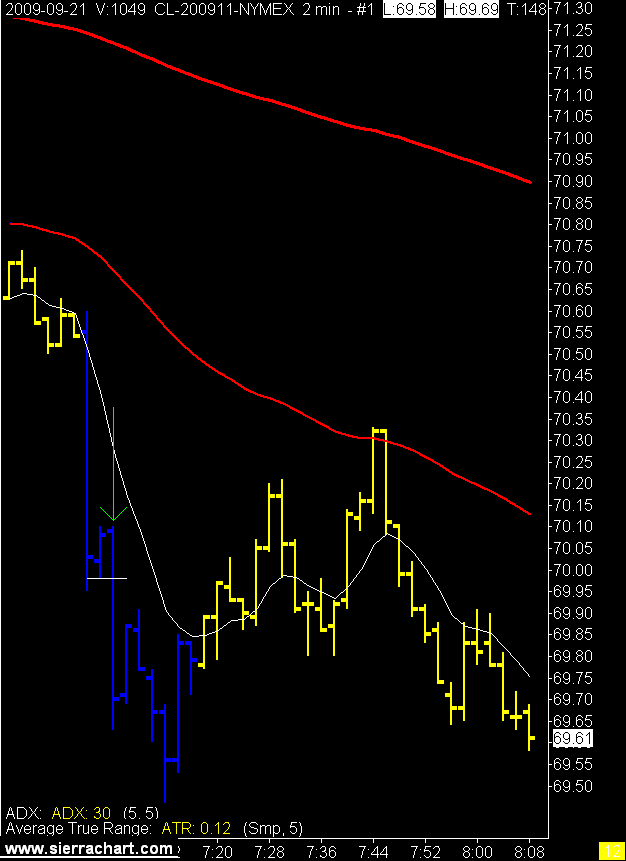
This was the only valid signal, yes it was blue on the tick chart as well.
2 Minute Crude Oil Chart

3 comments:
I keep meaning to ask, because I mostly scan over any charts here, is there a post somewhere that gives a basic outline of your strategy?
Obviously you don't want to 'put out' 100% but it would me nice to have a indication of what I'm looking at.
My brain just gets a bit confused when searching for the regular pearls of wisdom scattered liberally between the charts!
Good question L&W.
I'm sure there is but I can summarize for you.
The blue bars are triggered by the ADX and ATR reaching a certain numerical level with price on the trade side of all the EMAs, and the 8 EMA on the trade side of the other 2 EMAs.
With that in place I am then looking to take a break of the first blue bar for entry, or if the break doesn’t happen on the first blue bar see a higher low for a short (see chart in this post) and then a break of that low.
Pretty simple, if I wrote it out correctly that is. :)
My stop is set at the minimum threshold I use on the ATR and my target is 3 times the stop. I move to break even + 1 tick after a1R move in my direction.
I believe it is a pure momentum play. The trick is to get the signal at a level that doesn’t hit false moves and doesn’t wait until the move is almost over.
Or is that the trick in all trading?
Emminently sensible.
But lacking in fun ;-)
I'll pay more attention to the charts now, thanks for the re-cap.
Post a Comment