Showing posts with label dow futures chart. Show all posts

11/26/2008

Is There Hope?


No, there isn't.
Happy Thanksgiving.
Ok maybe, but not just yet.

We have so far to go before there is hope it's hard to even see it. I know we have Barack Obama's, yes we can, working for us. But, 21 days ago the DOW futures were over 9600. We haven't even got back to there yet.

We have a long way to go and I want to get there as fast as anyone, I'm 100% invested, and it's all long equities.

We have had a little 4 day rally, it's meaningless.

Sorry.

I hope, there's that word, that we have seen the bottom, I hope my negative post today looks foolish in the future, I hope Barack Obama and his team turn it all around.

I hope.

But I don't believe.

This house of cards cannot be rebuilt with debt. The house needs to crumble, and those who survive have to build a new one. With all governments adding more cards to the current house it only postpones the inevitable.

The house is going to fall down.

So why do I stay long in equities?

I think mine are survivors, they are paying me handsomely while I wait, and I can't miss any of the up move if there ever is one.

Besides that if you don't have hope, what do you have?

Cash. LOL

11/21/2008

It Was Close

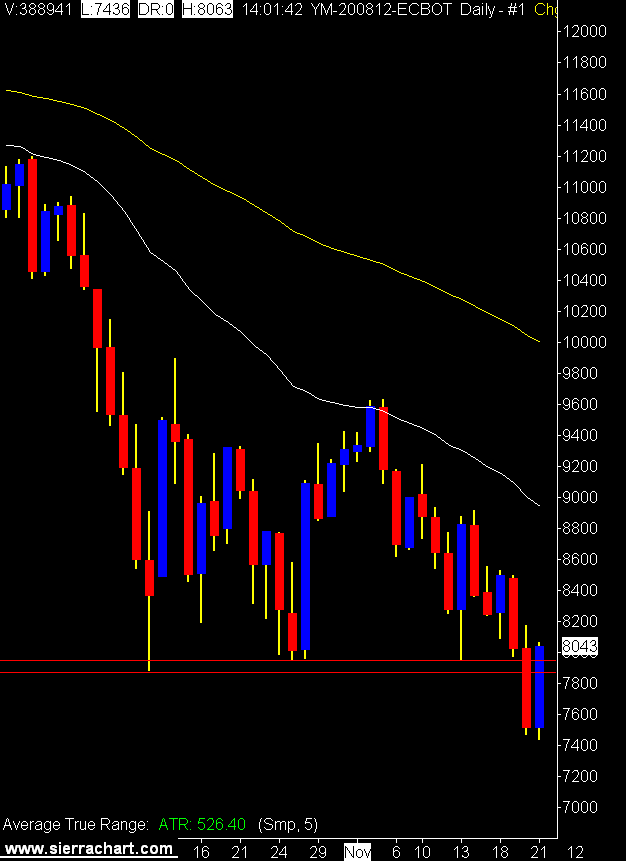
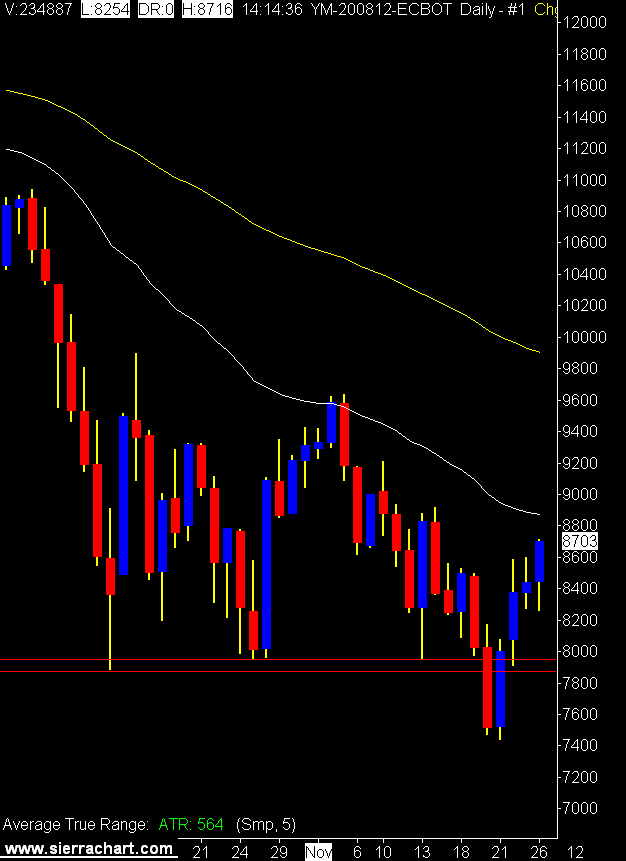
Daily DOW Futures
Yesterday we entered the land of no return.

Today I jumped, but at the last second turned and grabbed the window sill around 1:00PM MST. I hung there by my finger tips and only with my super manly brute strength was I able to pull my self back in.

We closed back in the land of milk and honey. Well, maybe the land of watered down soup and crackers. Apparently we were saved by (other than my super manly brute strength) Barack Obama's cabinet selections. Good on ya man, come back and save us some more on Monday.

If you trade take a look at the last hour of these 15 minute charts, that is the only time you need to trade.

15 Minute DOW Futures

11/13/2008

DOW Uncrushed

LOL

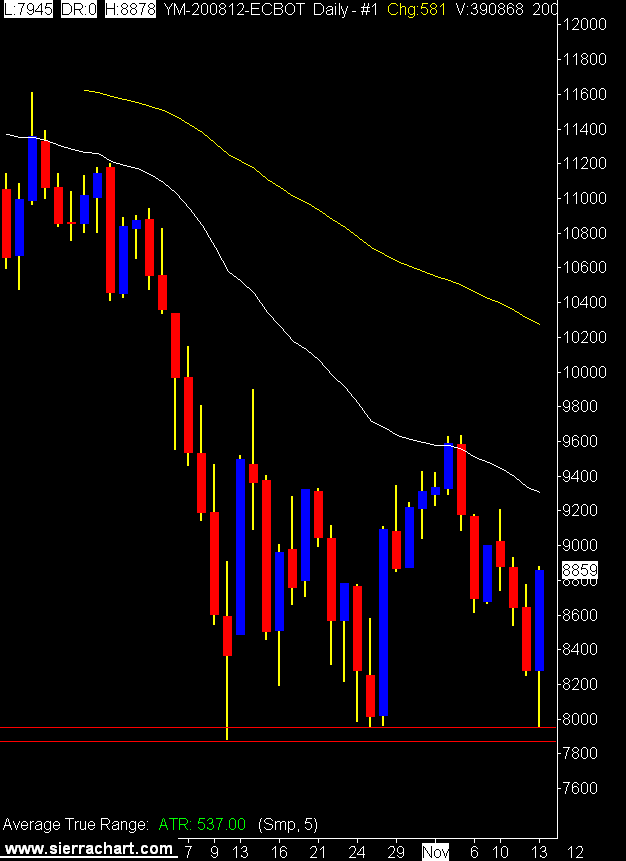
Yesterday I basically called the end of the world as we know it, and today; a reprieve, a reprieve!

It certainly was a great day for trading.

The daily chart has an interesting pattern on it now, a triple bottom perhaps? The second and third legs don't quite touch the first one, but hey the DOW went up so let's think positive.

Could we have seen the bottom?

Naw.

10/29/2008

The Bear is Alive!

Whatever.

I have been adjusting my trading plan these past couple of weeks and have taken some time to review my trading history and where I want to go in the future.

I have looked backward to reinforce what I believe in and answered some basic questions that I have answered before, but have drifted away from for whatever reason.

Starting with what is the basic premise that I am trading?
For me it is trading with the trend. Identifying the trend on a higher time, trading that trend on a lower time frame.

Here are some questions I have written answers for again. I’m not giving you my answers because you must trade your own answers.

1) What defines a trend?
2) What defines your entry point?
3) What defines your exit point?
4) When can you re enter the market after a trade?
5) How much are you willing to lose on a trade?
6) When, if ever, do you move to break even?
7) How much are you prepared to lose in a day?

I think the most important questions for me in that group are trend identification and when can you re enter after a trade. My diabolical need to be right manifests itself in revenge trading, which is a bad thing, a very bad thing.

These questions must have answers before you enter the market. The answers to these questions must be backed up by statistics that demonstrate your trade has a statistical edge in the marketplace.

Then you trade.

If you can think of any other questions I’m missing let me know.

Today's results were 99 winning tics / 43 losing tics = RR 2.30, 4 wins, 4 losers, 2 break evens.

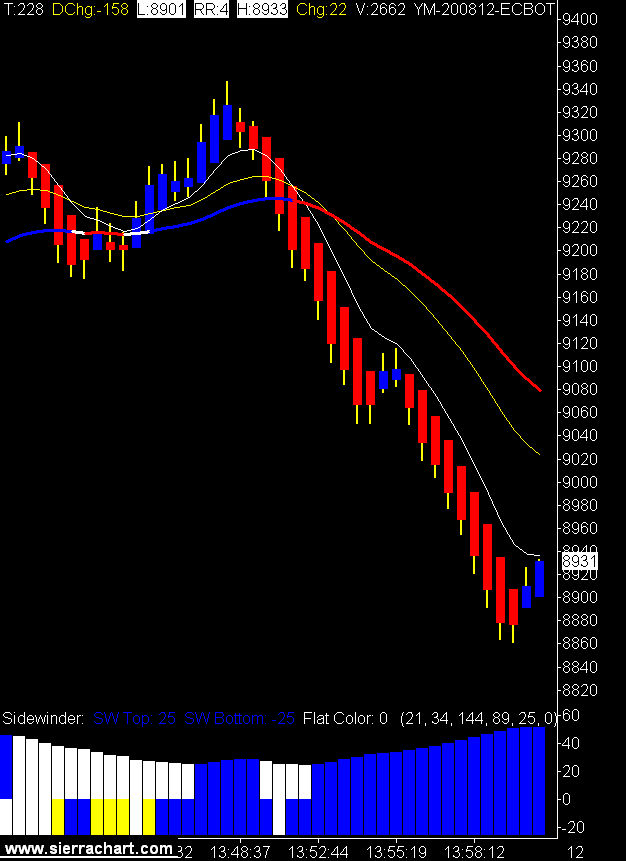
I have resurrected my 34 tic range bar chart as the trend identifier. These charts show the wild moves in the last hour of the session.

Mini DOW Futures 34 Tic Range Bar Charts

10/28/2008

The Bear is Dead!

Ha ha.

We will probably go down a thousand points tomorrow.

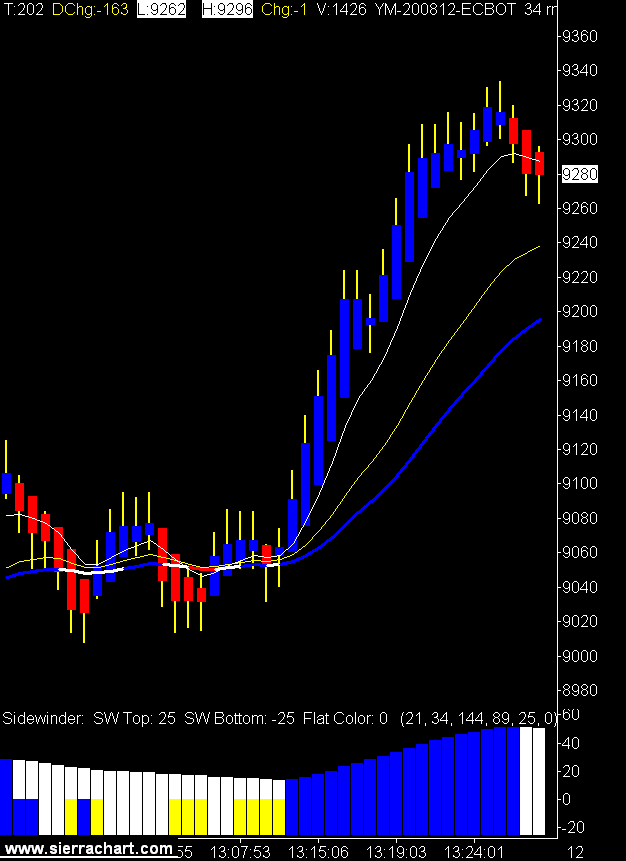
A wild day to say the least.

My results were 180 winning tics / 21 losing tics = RR 8.57 on 14 trades. 7 winners, 5 break evens, and 2 full stops.

I moved my stop up to 10 and left the target at 25.

They say a bull market makes everyone an investing genius. The same holds true for a trending day in the markets, it makes everyone a trading genius. The key is to find a system that can take advantage of a day like this, while still being able to identify a non trending market so you don't give it all back when the market goes flat.

I'm still working on that.

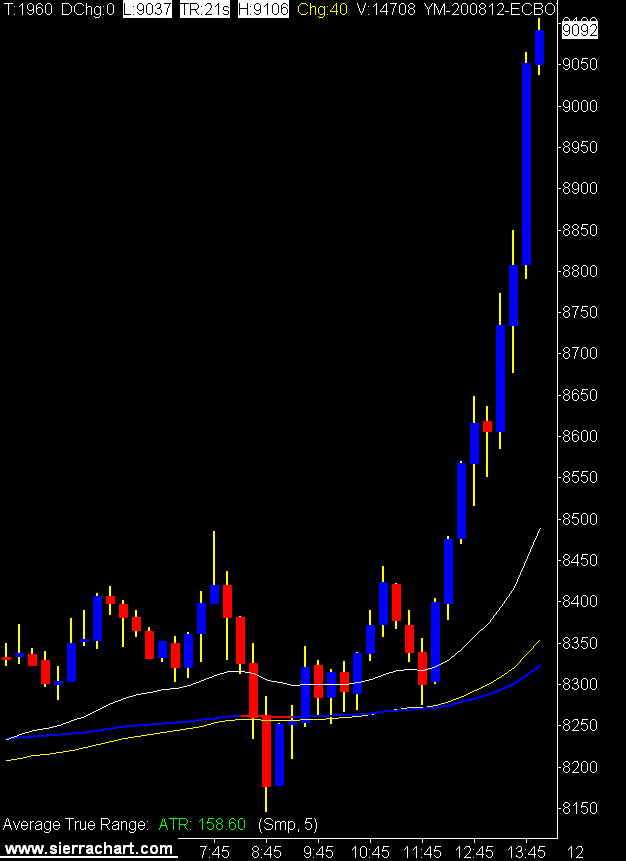
Here's a 15 minute chart that shows the power move up this afternoon.

15 Minute Mini DOW Chart