We will probably go down a thousand points tomorrow.
A wild day to say the least.
My results were 180 winning tics / 21 losing tics = RR 8.57 on 14 trades. 7 winners, 5 break evens, and 2 full stops.
I moved my stop up to 10 and left the target at 25.
They say a bull market makes everyone an investing genius. The same holds true for a trending day in the markets, it makes everyone a trading genius. The key is to find a system that can take advantage of a day like this, while still being able to identify a non trending market so you don't give it all back when the market goes flat.
I'm still working on that.
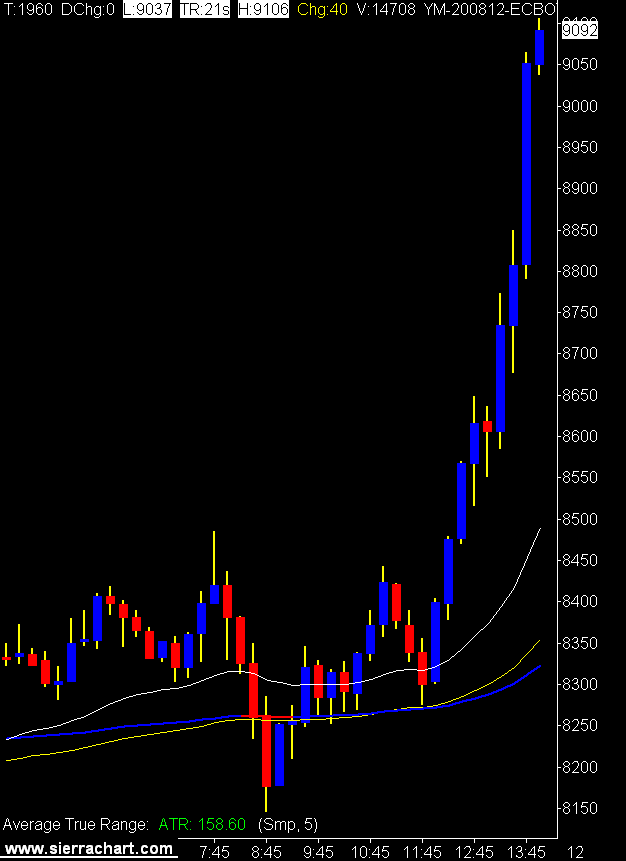
Here's a 15 minute chart that shows the power move up this afternoon.
15 Minute Mini DOW Chart

2 comments:
what timeframe chart are you trading from?
I'm not posting any trading charts right now as the plan is, shall we say, evolving.
Today I was trading a 13 tick range bar chart for entries with a 34 tick range bar chart for trend definition.
If you look at the posts from May you will see some crude oil charts with the same basic set up.
Post a Comment