8/28/2008

Trade What You See

Hurricanes, Wars, GDP, all bullish for oil.

Right?

Wrong, oil goes down.

I don't know why, and most importantly I should not care why.

I'm supposed to trade what I see, not what I (or anyone else) think.

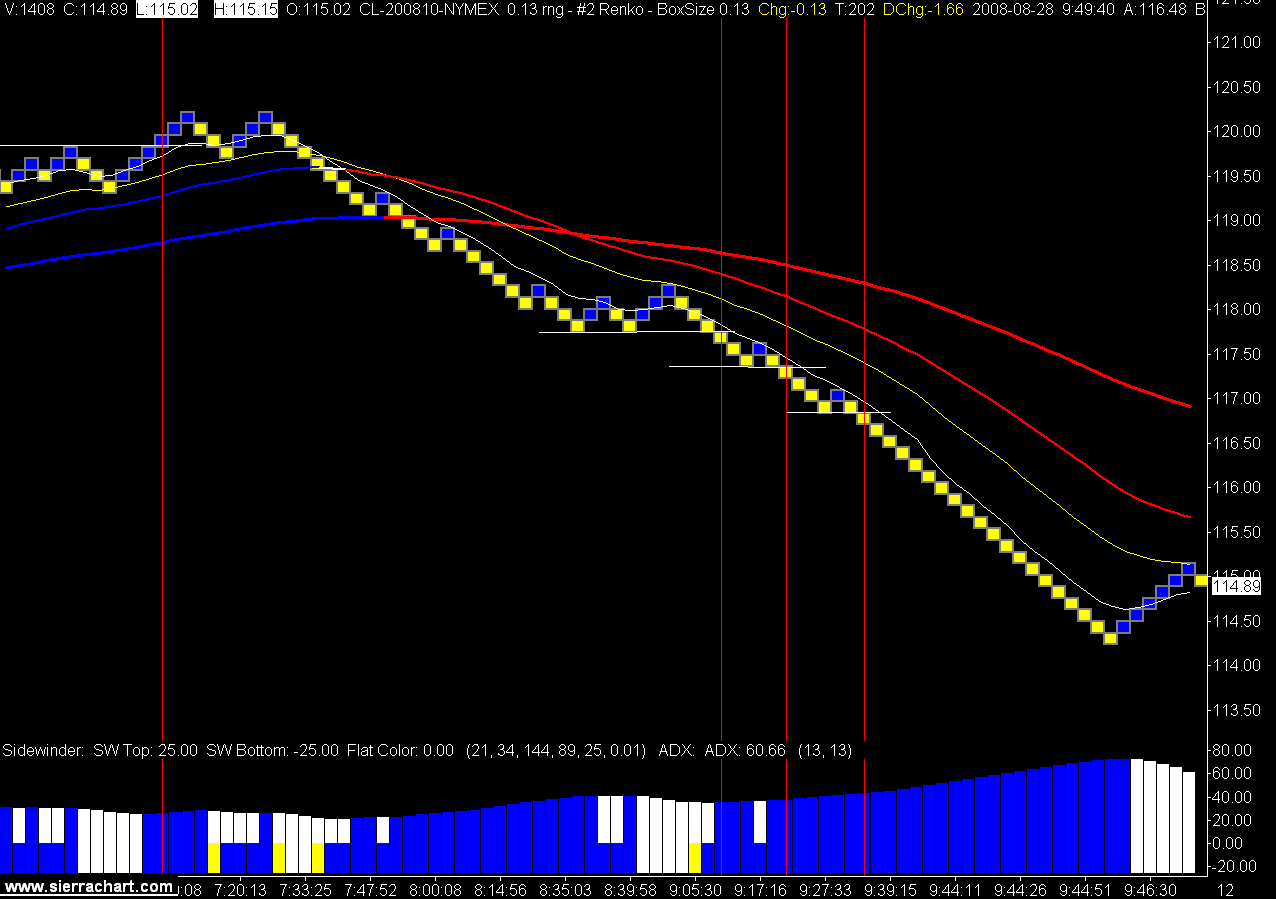
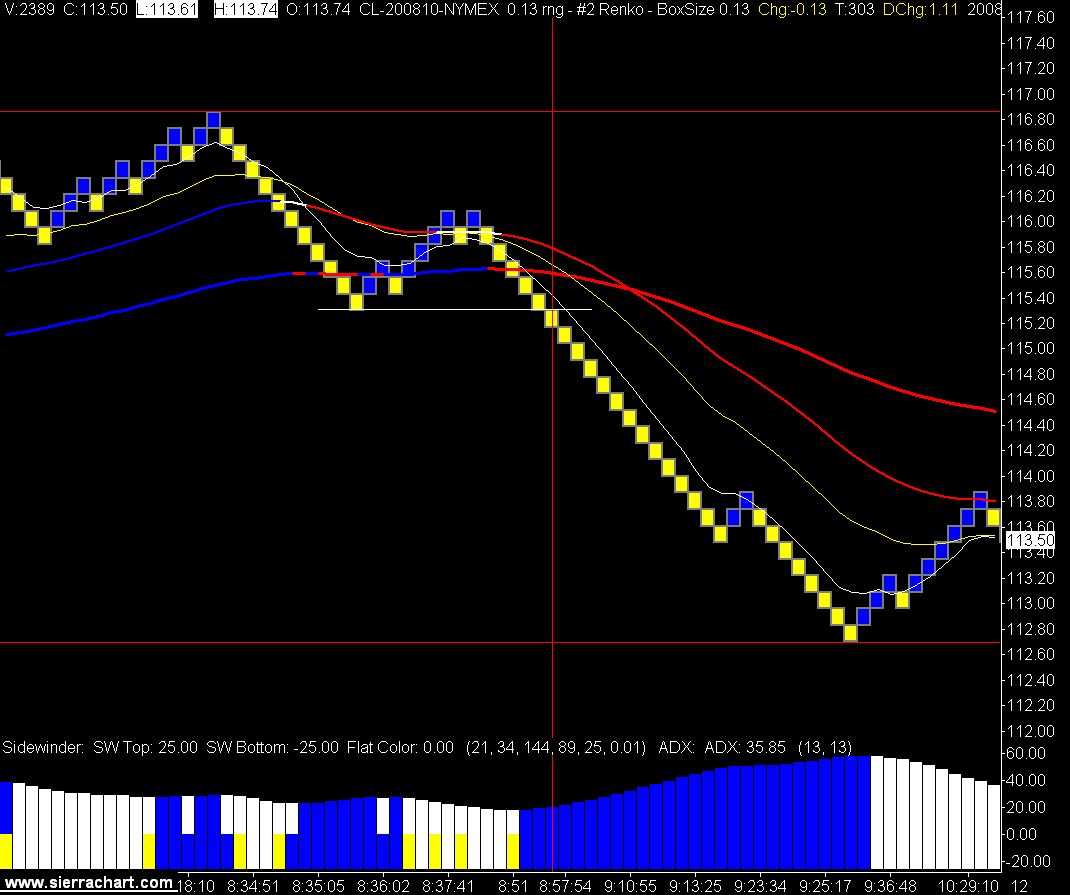
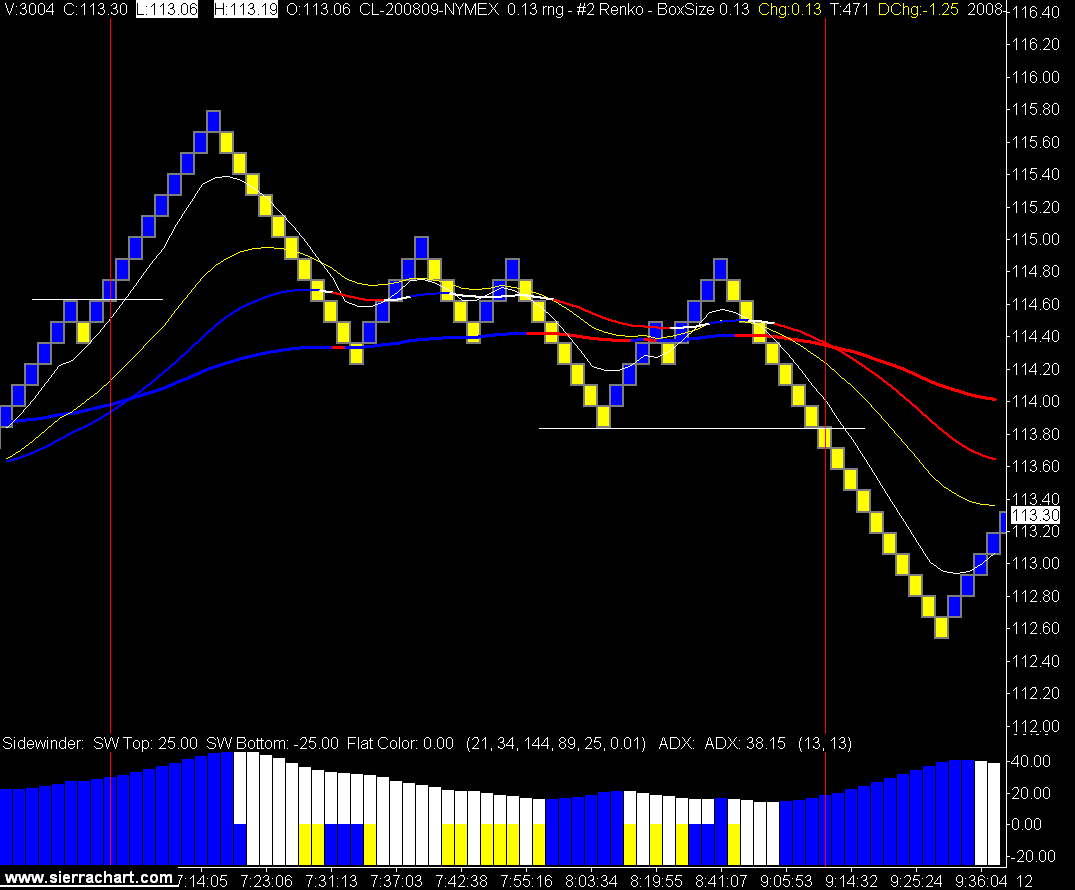
I took a couple of trades as oil was breaking $120 this morning. I was expecting a big upside move if we could get through $120. We got through $120.

Then we went down.

I hit my daily stop and was not able to participate in the nice downtrend later in the session.

That's my plan.

I trade my plan.

13 Tick Crude Oil Renko Chart (click to view)

8/27/2008

We Believe

Capital is scarce.
Don’t fight the tape.
The trend is your friend.
Trade what you see not what you think.
Stops are not losses, they are business expenses.
A person’s beliefs are always revealed by their actions.
The urge to trade is stronger than the urge to trade profitably.


We believe that markets move in waves based on fear and greed. We cannot anticipate these waves and will not try to. We will instead recognize when one of these waves has begun and join in as the wave moves up or down. This type of trading is known as trend following.

We believe that markets form patterns that can be identified on a historical basis and this information can be projected onto the right hand side of the chart to provide an indication of the strength in the trend and the speed at which it is occurring.

We believe that money management not technical analysis is the key to success in the trading business. By researching, building, and tracking a trading program we can overcome the human emotions that derail most traders. This data base of statistics will have to prove the system from a numerical basis in order to provide us the emotional intelligence required to stay in this business.

Human emotions are derived from the very core fight or flight instincts that are programmed into us all. We must control these emotions in order to rise above the trading herd that is heading down the path to financial ruin.

Our trading plan backed up by our statistical database provides us the emotional capital required to allow us to preserve and grow our financial capital.

“Truth will be truth, regardless of a closed mind, ignorance, or the refusal to believe.”

Napoleon Hill, Think and Grow Rich

8/26/2008

Do You Have a Trading Plan?

So far 5 votes in the gigantic Trading Crude Oil poll.

Hmmm, that means:

a) no one reads this blog.
b) those who do read this blog don't actually trade.
c) those who do trade and don't have a plan do not want to admit it.
d) people don't like silly polls.
e) none of the above.

Throw me a bone here people, vote in my stupid poll just to make me feel better.

Today's trades.

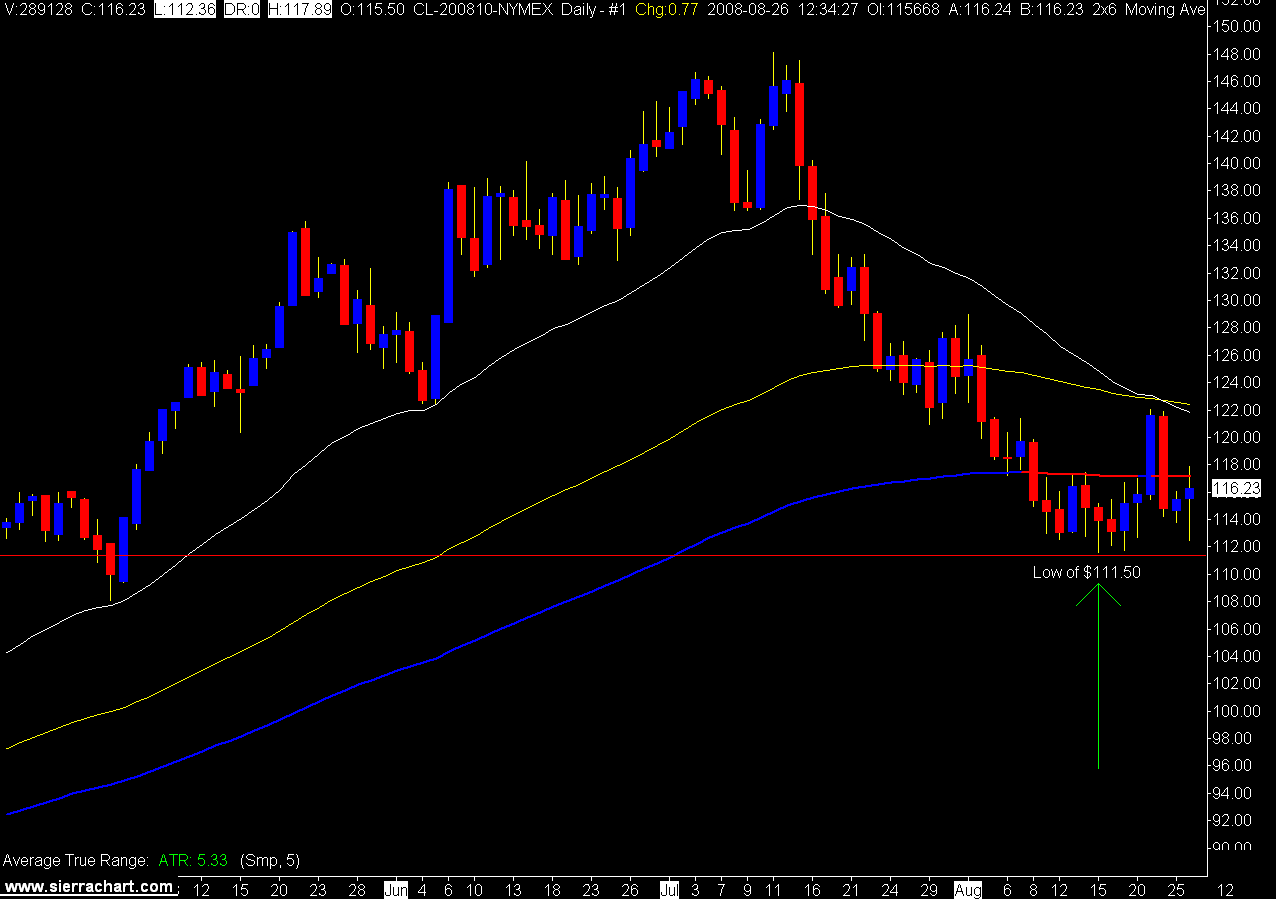
Daily Crude Oil Chart

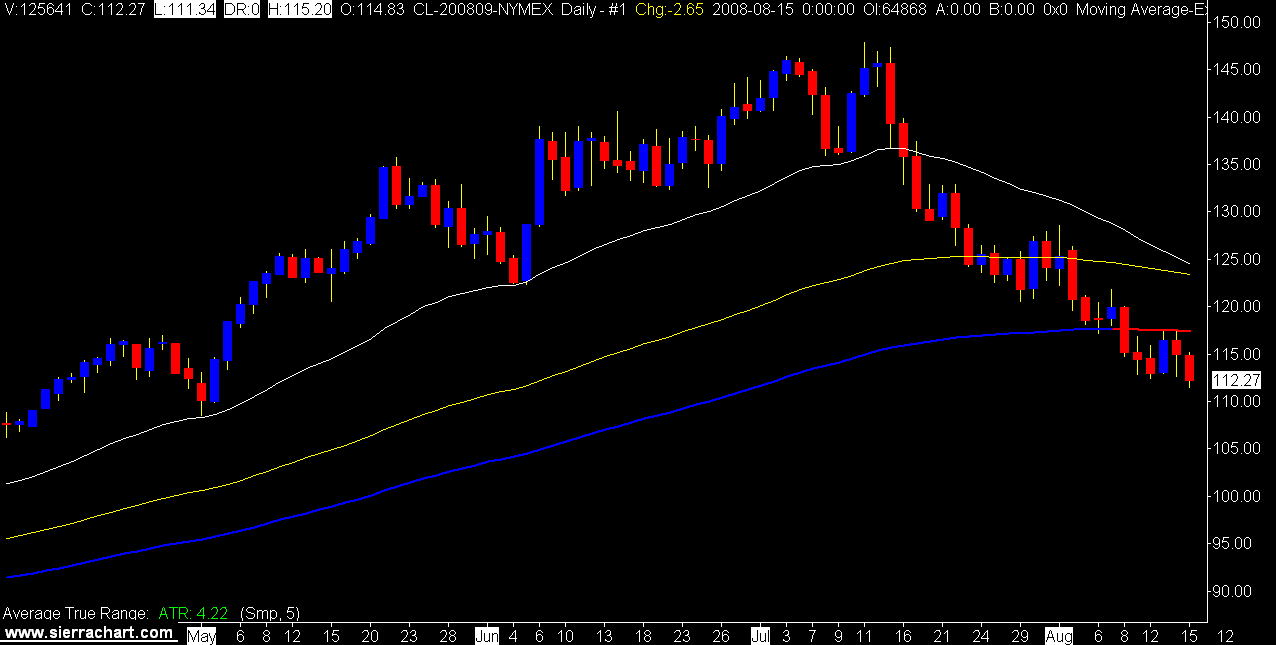
We are seeing a real period of consolidation on the daily chart, and with the exception of Aug 21 and 22 we are stuck in a range around the 144 EMA.

It will be interesting to see what happens on the downside if the $111.50 low of Aug 15 is breached.

That would be pushing crude down to prices not seen since May.

Daily NYMEX Light Sweet Crude Oil Chart

8/22/2008

Buffett and Gates tour Alberta oil sands

Anthony P. Bolante/Reuters Files

CALGARY -"Two of the world's richest people, Microsoft Corp. founder Bill Gates and his friend, American investment magnate Warren Buffett, quietly flew into northeastern Alberta on Monday, where they took in the oil sands, apparently with awe." Financial Post

Click on the read more icon for the full Financial Post story.


read more | digg story

8/21/2008

One trader held 11 pct of Nymex oil contracts

NEW YORK - "A single energy conglomerate held 11 percent of all contracts on the New York Mercantile Exchange at one point last month, according to a published report today, suggesting that speculators may have played a larger part in volatile oil markets than once thought." AP via the Boston Herald

It wasn't me. :)

A few questions here to say the least.

Are they insane?
How much do they own now?
Did they make any money?
Did they get killed in the drop from $147?
Are they insane?

http://www.vitol.com/

Click on the read more icon for the full Boston Herald story.


read more | digg story

Urban Oil Drilling

"A new landscape is being tapped for oil wells: residential neighborhoods." CNN Money

This is kind of funny, kids don't play on the pump jack.

Click on the read more icon for the CNN Money video.


read more | digg story

The Politics of Oil

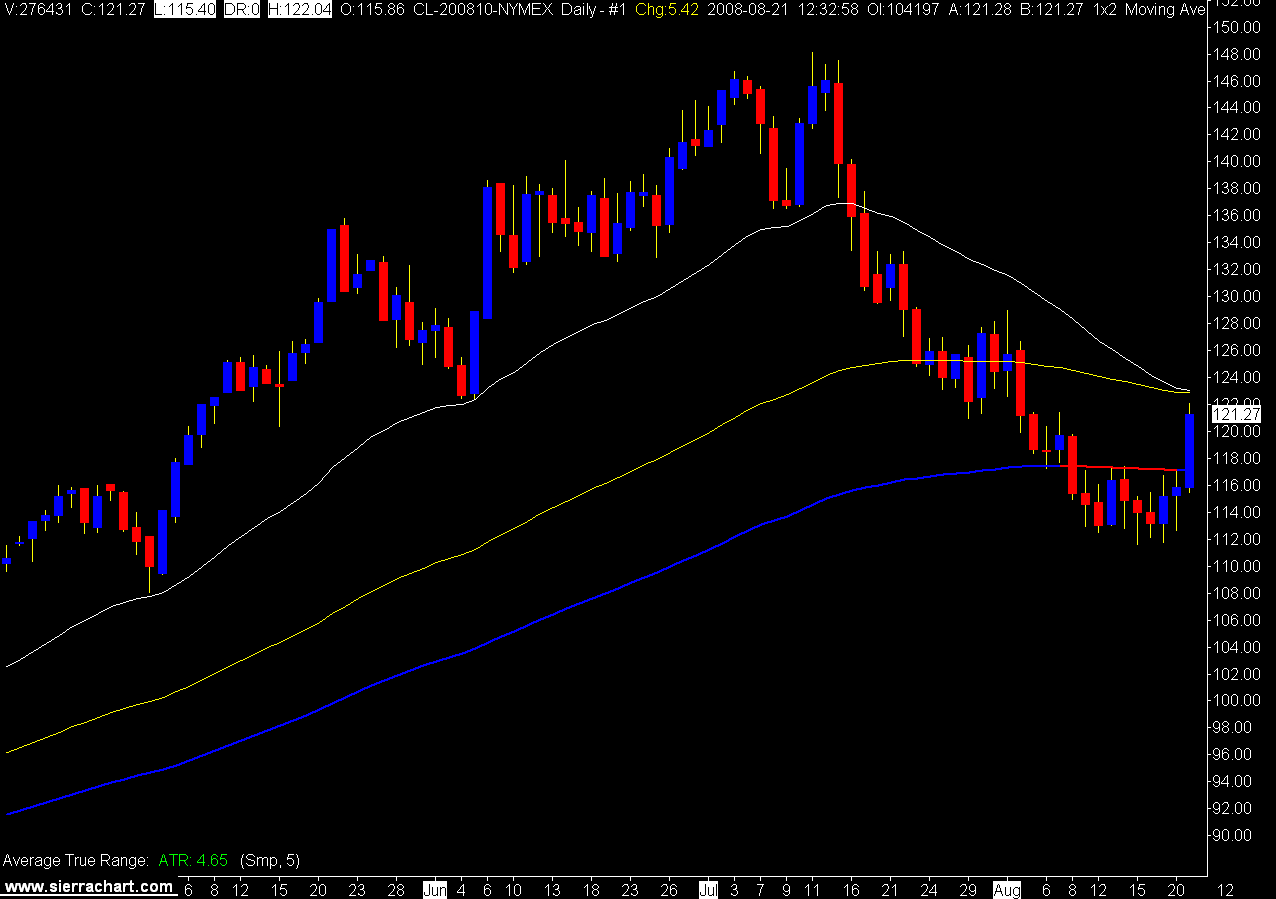
The Russian / Georgian / American conflict seems to have lit a fire under the crude oil market. Crude traded up to $122.04 today and the bull may stick until the Russians get out of Georgia.

I think the Russians are informing the world (make that America) that in the universe of $100 plus oil they are now an oil super power. With the point being that the Americans are not an oil super power.

Country Rank Proved Oil Reserves
(billion barrels)
1. Saudi Arabia 264.3
2. Canada 178.8
3. Iran 132.5
4. Iraq 115.0
5. Kuwait 101.5
6. United Arab Emirates 97.8
7. Venezuela 79.7
8. Russia 60.0
9. Libya 39.1
10. Nigeria 35.9
Source: Oil & Gas Journal, Vol. 103, No. 47 (Dec. 19, 2005). From: U.S. Energy Information Administration.

This is a quite a change from the military cold war between the former Soviet Union and the United States. The case may be made now that those with the most oil become the most powerful countries in the world.

Unless those with the military might come and take it.

This is all a reminder of why crude oil is such a dynamic product to trade as the political ramifications are as important to price as are the economics.

Crude Oil Daily Chart

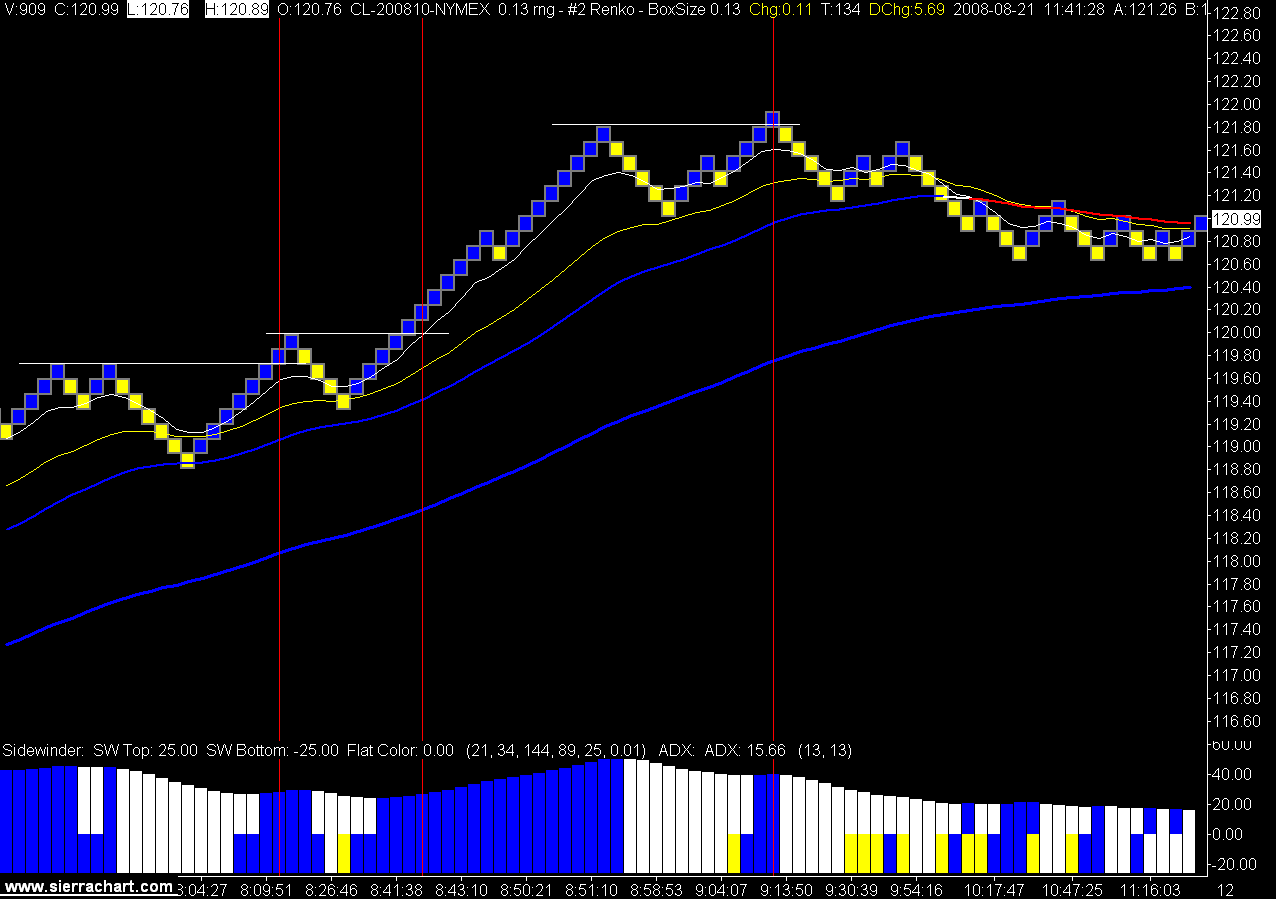
The renko chart did a nice job of finding some trades however the Alberta weather kept me out of the market for the fist hour or so. A thunder storm had the office power supply going in and out so I stayed out of the market until the storm passed.

Took 2 trades today with a full stop and then a winner. There was one more signal triggering as crude hit the high of the day at $120.04 and I had my stop limit order in at $120.06 and was not filled. It would have been a full stop loser if it had been filled.

13 Tick Renko Crude Oil Chart

8/20/2008

Newfoundland Hits the Jackpot

"After signing an agreement concerning the long delayed Hebron offshore oil project, Newfoundland and Labrador Premier Danny Williams said the province "will never be the same again." CTV.CA

Those of you south of Fort McMurray probably don't know that half the work force in Fort Mac is from Newfoundland. If they all go home to work in the Hebron oil fields the oilsands may grind to a halt. :)

It's all good news for Newfoundland.

Click on the read more icon for the full CTV story.


read more | digg story

Oil is Up, Down, Up

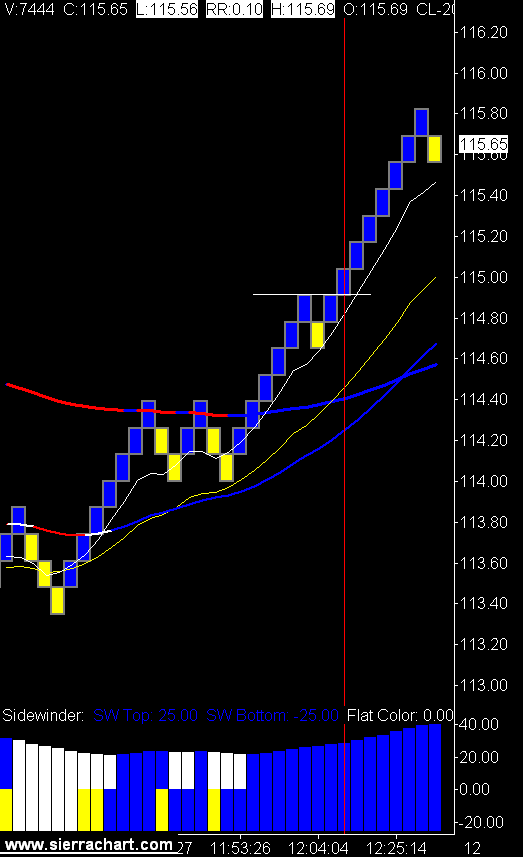
Oil traded all over the map today with a high of $117 before the crude oil inventory report. After the report we saw a drop down to $112.60 and then a rally up to $115.81 as the New York session closed.

I did not trade before the report, usually a wise decision, and caught a good portion of the down move. Took 2 swings to get long at the end of the session with a full stop and then a nice winner to end the day.

I'm using a 5 tick Renko bar chart to help find an entry point on the trend I see with the 13 tick Renko chart.

All in all a nice day.

13 Tick Renko Crude Oil Chart (click on chart to view)


Gold and Inflation

Paul van Eeden was on BNN today, (click on the post title for the video link) I always enjoy his macro outlook on the economy.

If you agree with his numbers for monetary inflation then the central bankers are in a very tough position. Curbing inflation and stimulating an economy are impossible to do as the interest rate decisions for both problems are the opposite of each other.

That should mean interest rates remain flat as the bankers hope that inflation will ease as economies cool.

Should being the operative word until the central bankers deem one problem worse than the other, or they have to appease their political masters.

Oil tumbles on surge in crude supplies

NEW YORK (CNNMoney.com) -- Oil prices turned lower Wednesday after a government report said crude inventories shot up much more than expected in the past week.

U.S. light sweet crude for September delivery fell $1.60 to $112.93 a barrel. Just before the Energy Information Administration released its report, oil was up $2.28 at $116.81.

Crude oil inventories climbed by 9.4 million barrels in the week ended Aug. 15. Analysts forecast a much more modest build of 1.7 million barrels according to a survey from Platts, an energy research firm.

The build in crude stockpiles was "way more than what the market was looking for and as a result we have come off our highs," said Andrew Lebow, an energy analyst at MF Global in New York.

Click on the read more icon for the full CNN Money story.


read more | digg story

8/19/2008

Renko Rides Trend to the End

The day started out very slow and I got a little anxious and took a trade before the EMAs were all on the right side of each other. Fortunately I got a break even on that one and then next one exploded to the upside.

The Renko bars called the top of trade and I got out with the ADX color change.

Nice day to trade crude oil.

13 Tick Renko Crude Oil Chart (click to view)

Off Shore Drilling Debate

Finally a calm, concise, rational debate on off shore drilling.

As Oil Giants Lose Influence, Supply Drops

Jorge Silva/Reuters
Workers in an oil field in Venezuela, one of the countries that experts say hold the oil supplies of the future.

"It is harder than ever for the major Western oil companies to find new prospects, even though they are awash in profits and eager to expand." Jad Mouawad, New York Times

Click on the read more icon for the full NY Times story.


read more | digg story

8/18/2008

Trading Fear Without Greed

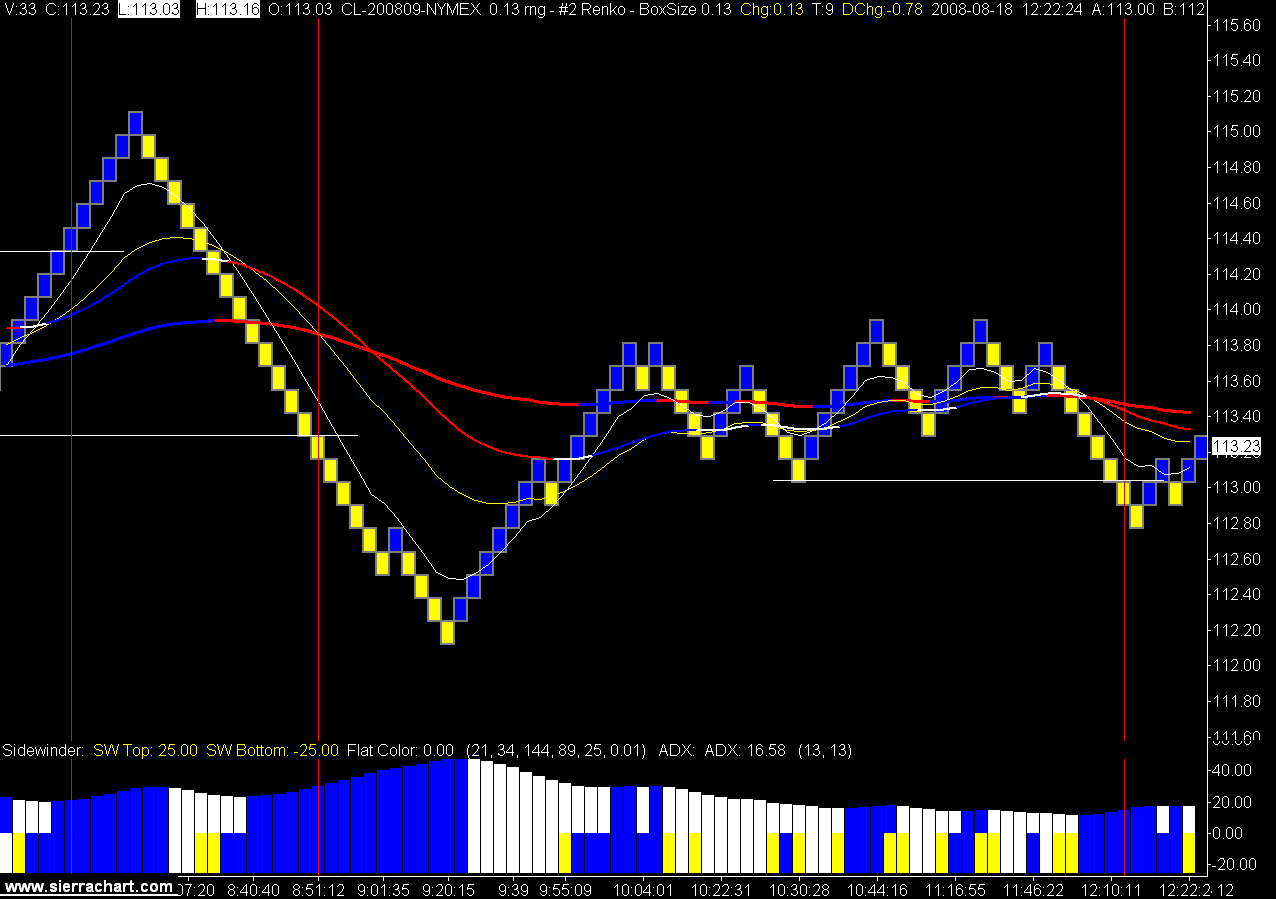
Another nice day trading the "devil's excrement" with a couple of good moves.

You have to watch Crude Awakenings in the post below to get the "devil's excrement" quote.

13 Tick Renko Crude Oil Chart (click to view)

A Crude Awakening

The world seems to think that "big oil" represents greed at it worst, or finest depending on your economics. In reality it's fear that has the price of oil north of $100.

This film is a few years old and certainly paints the worst picture, but is interesting as we see oil come down off its all time highs.

8/16/2008

Canada Wins Gold

"Huynh is golden." Globe and Mail

Another beautiful picture.

Finally!!

Canada's medal drought in the 2008 Olympics is over.

This is Canada, a country of immigrants all proudly wearing the Maple Leaf.

Hurray!!

Click on the read more icom for the full Globe and Mail Story.


read more | digg story

Oil falls below US$114 on global demand worries

Reuters

What a beautiful picture, how can environmentalists say offshore drilling is bad? Look at it, it's beautiful. :)

$100 crude is not far away and if it gets through $100 the crude oil trade will get very interesting.

Click on the read more icon for the Reuters National Post story.


read more | digg story

8/15/2008

Crude Oil Heading Down to $........

Not much happening for me in the trading yesterday, the signals had initial movement but then retraced for break even stops.

The daily chart has an interesting look with the 144EMA breached, than a double retouch of the 144, and then today a new lower low.

This could make for an entertaining ride next week.

If you swing trade this is interesting, if you day trade it is not interesting, if you don't trade at all you're just confused.

Crude Oil Daily Chart (click on chart to view)

8/13/2008

Trading Like Robert the Bruce

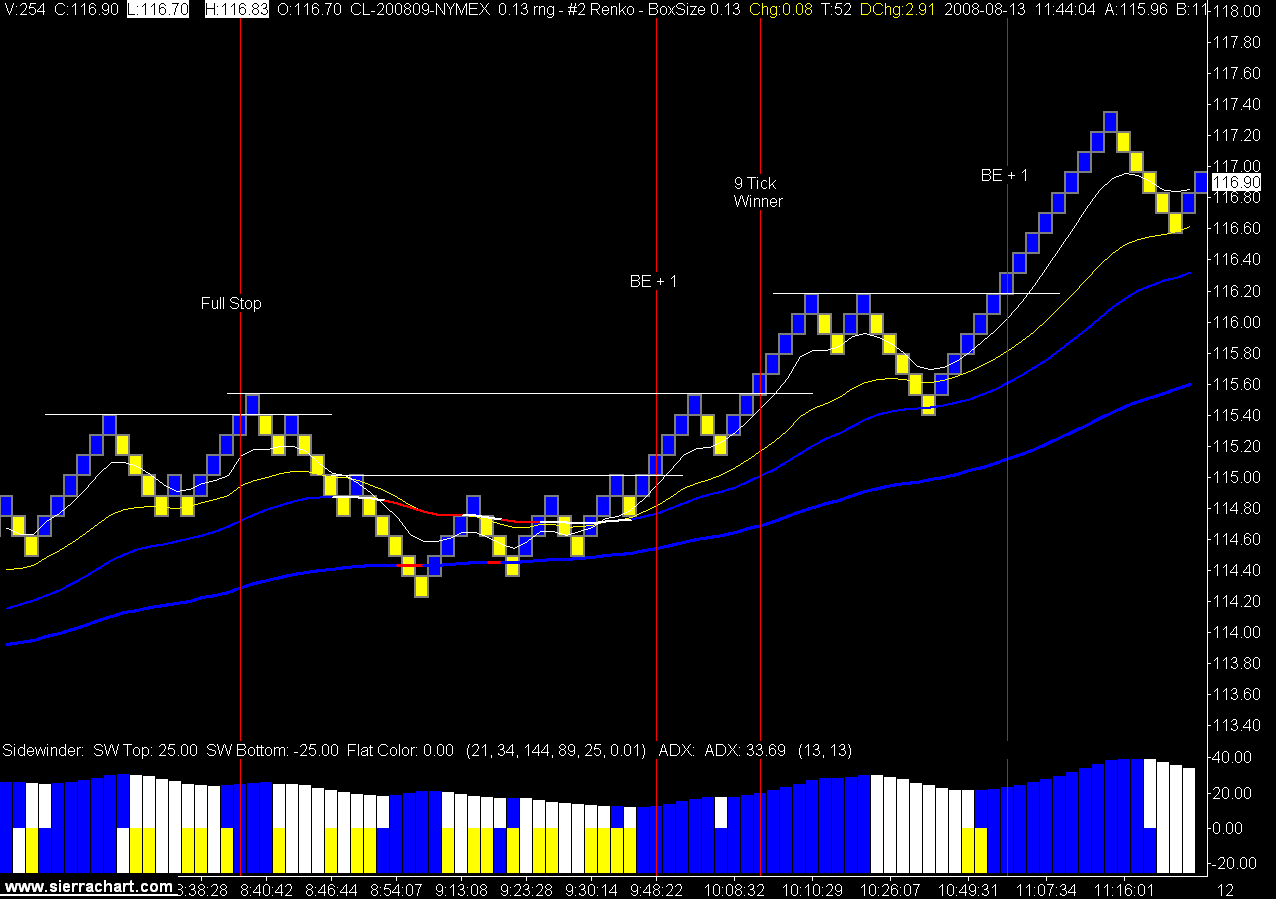
An Irish trader told me the story of Robert the Bruce and the Spider today. I was plugging along and not getting much for my efforts so the Irish trader thought this would keep me going.

Bruce and the Spider
(Scotland)
HUNDREDS of years ago there was a king of Scotland and his name was Robert the Bruce. It was a good thing that he was both brave and wise, because the times in which he lived were wild and dangerous. The King of England was at war with him, and had led a great army into Scotland to drive him out of the land and to make Scotland a part of England.

Battle after battle he had fought with England. Six times Robert the Bruce had led his brave little army against his foes. Six times his men had been beaten, until finally they were driven into flight. At last the army of Scotland was entirely scattered, and the king was forced to hide in the woods and in lonely places among the mountains.

One rainy day, Robert the Bruce lay in a cave, listening to the rainfall outside the cave entrance. He was tired and felt sick at heart, ready to give up all hope. It seemed to him that there was no use for him to try to do anything more.

As he lay thinking, he noticed a spider over his head, getting ready to weave her web. He watched her as she worked slowly and with great care. Six times she tried to throw her thread from one edge of the cave wall to another. Six times her thread fell short.

"Poor thing!" said Robert the Bruce. "You, too, know what it's like to fail six times in a row."

But the spider did not lose hope. With still more care, she made ready to try for a seventh time. Robert the Bruce almost forgot his own troubles as he watched, fascinated. She swung herself out upon the slender line. Would she fail again? No! The thread was carried safely to the cave wall, and fastened there.

"Yes!" cried Bruce, "I, too, will try a seventh time!"

So he arose and called his men together. He told them of his plans, and sent them out with hopeful messages to cheer the discouraged people. Soon there was an army of brave men around him. A seventh battle was fought, and this time the King of England was forced to retreat back to his own country.

It wasn't long before England recognized Scotland as an independent country with Robert the Bruce as its rightful king.

And to this very day, the victory and independence of Scotland is traced to a spider who kept trying again and again to spin her web in a cave and inspired the king of Scotland, Robert the Bruce.

13 Tick Renko Crude Oil Chart (click to view)
Goldman, Morgan Stanley Among Dubai Merc Investors

There is a good book, Rigged, by Ben Mezrich, about the start of the Dubai Merc. It's also a entertaining look at the traders on the NYMEX.

"Goldman Sachs Group Inc., Morgan Stanley and four energy-related companies are taking minority stakes in Dubai Mercantile Exchange Ltd., adding clout to the fledgling exchange as it seeks to establish itself as a major player in the global crude oil market." (AP)

Click on the read more icon for the full CBS News story.


read more | digg story

Crude Oil Barrel Count

EIA Petroleum Status Report

The Energy Information Administration (EIA) provides weekly information on petroleum inventories in the U.S., whether produced here or abroad. The level of inventories helps determine prices for petroleum products.

Released on 8/13/08 For wk 8/8 2008
Crude oil inventories (weekly change)
Actual -0.4M barrels
Previous 1.7 M barrels

Highlights
Gasoline stocks plunged 6.4 million barrels in the Aug. 8 week to 202.8 million, a drawdown that tripped an immediate rise in oil prices. Stocks of crude oil slipped 0.4 million barrels to 296.5 million with distillate stocks making it a clean sweep, down 1.7 million barrels to 131.6 million. Refineries, operating at a very mild 85.9 percent of capacity, are cutting back on production as oil and pump prices fall. Gasoline production in fact declined in the week though supply is still 0.1 percent higher than a year ago. Despite the cut in production, gasoline supply continues to exceed demand which is down 1.9 percent on the year. Jet fuel demand is much lower, down 8.5 percent year-on-year. Oil prices may rally in reaction to this report but the long term outlook for slowing economic growth is likely to overshadow weekly changes in inventories.

Trends
As is evident from the chart, crude oil stocks can fluctuate dramatically over the year. When oil prices nearly reached $50 per barrel in August 2004, financial market players began to monitor crude oil inventories. It is not surprising to see sharp price hikes in crude oil when inventories are falling. Conversely, one would expect price declines when inventories are rising.


Data Source: Haver Analytics | Consensus Data Source: Market News International and Thomson Financial

8/12/2008

Crude Oil Blues

Today's the day for funky music videos on Trading Crude Oil.

Trading the Plan, Even if it Hurts

Only 2 signals today, which is a good thing as I would rather trade less than more.

Both signals were clear, both signals had nice follow through, and I lost money on both signals.

The 12 tick stops were not wide enough to keep me in and I do not try and re enter until that move is over. In other words I have to wait for a new signal. This rule is in place to keep me out of my revenge trading mode.

That's they way it is with trading, sometimes it's all there and you don't get anything but pain. Which is why people change their plan over and over. I will just show up for work tomorrow and do the same thing.

13 Tick Renko Bar Crude Oil Chart (click on chart to view)

Think Before You Trade

If the trade the markets guys are as good at trading as they are at marketing they must be very rich.

Anyway it's a funny video.

8/11/2008

Crude Oil Down Again

These speculators simply must be stopped!

The price of oil keeps going down, who is to blame?

Ok, not very funny but you get the point. China's oil imports have dropped, American's gasoline consumption has dropped, it's as if economics actually work.

The trading day started out slow and then caught a nice downtrend. Four trades on the day: 1) small winner, 2) break even, 3) big winner, and 4) full stop out.

Trade the plan, trade the plan, trade the plan and when you're done that, trade the plan.

The renko bars are working nicely, they do a nice job of ignoring the chop and holding you in a trend longer than the plain range bars.

13 Tick Crude Oil Renko Bar Chart (click on chart to view)


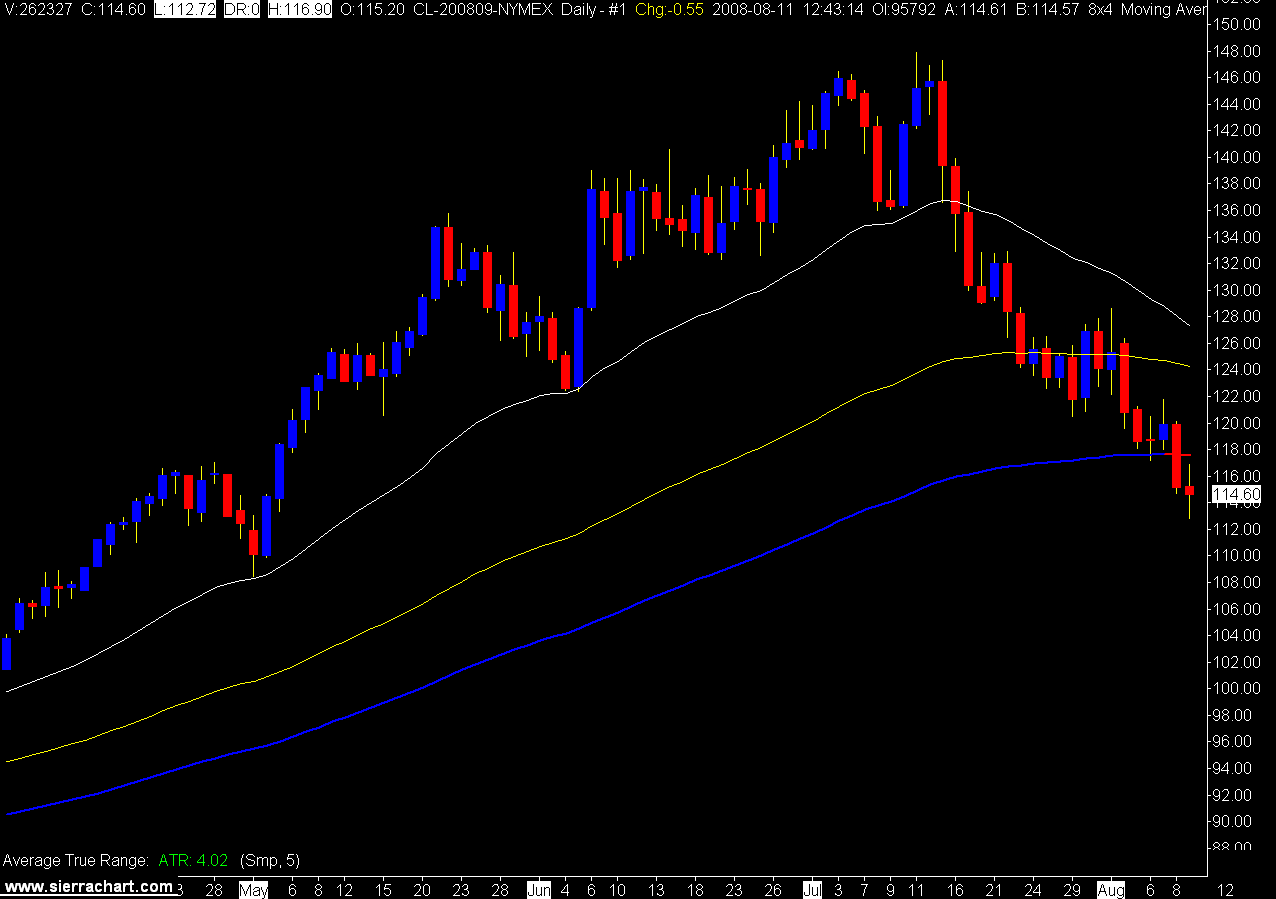
The daily crude oil chart has now broken free of the 144EMA, how low it will go is anybody's guess, $100 could be an interesting test.

Daily Crude Oil Chart

Has oil price bubble popped or temporarily deflated?

The oil price predictions change as fast as the actual price of oil.

Click on the read more icon for the full Vancouver Sun story.

read more | digg story

8/07/2008

Crude Oil Renko Chart

I have been looking at Renko charts for the past couple of days and traded it live today for the first time.

Thanks to J the FX wizard for the heads up on Renko charts.

There doesn't seem to be alot of info on the web about Renko charts so if you have anything to offer please post your comments.

This is the Investopedia information.

A type of chart, developed by the Japanese, that is only concerned with price movement; time and volume are not included. It is thought to be named for the Japanese word for bricks, "renga". A renko chart is constructed by placing a brick in the next column once the price surpasses the top or bottom of the previous brick by a predefined amount. This type of chart is very effective for traders to identify key support/resistance levels. Transaction signals are generated when the direction of the trend changes and the bricks alternate colors.

I have been using range bars for my entry chart and the renko bars are just a different type of range bar. The key being they have to move past the previous bar by the set number of ticks you choose, not just oscillate in that range.

We shall see how things go from here but I like what I see so far.

Only 2 signals today as I waited for a previous low to be taken out before entering.
One winner and one loser and a nice demonstration of let your winners run and cut your losers quick. The daily reward / risk ratio was 7.76.

13 Tick Renko Range Bar Chart (click on chart to view)

Black Gold, Texas Tea

Make that North Dakota Tea.

The Bakken oil formation extends up into Saskatchewan and has had the same affect in that province as North Dakota.

Still nothing like striking oil to change your life, reminds me of a old tv show, come and listen to a story about a man named Jed......

"In Stanley, N.D., an oil boom sweeps across the farming plains, turning middle-class folks into millionaires overnight." CNN Money

Click on the read more icon for the CNN Money video.


read more | digg story

8/06/2008

How Low Will Crude Oil Go?

Crude oil seemed to find some support around the 89EMA as it stuck to it for 9 days. However it has now broken free of the 89EMA and is sitting on the 144EMA. If it breaks this level $100.00 can't be too far away.

Of course I don't make long term price predictions.

Mainly because I'm always wrong.

Daily Crude Oil Chart (click on chart to view)

8/05/2008

Lower Oil Prices aren't Always a Good Thing

"With the cost of a barrel of oil decreasing, the benefits of that to the consumer are immediately enjoyed. But, the fall of oil can indicate that a recession is in our future." By Colin Barr, senior writer Fortune magazine

The outlook for the US economy is getting just a tad bleak.

Click on the read more icon for the full Fortune article.

read more | digg story

8/04/2008

Trade the Plan, Moron

Nice downward move in the crude oil market today. My trading signals were all intact, 3 minute chart had the 34EMA under the 89EMA for a short trend. The 16 tick range bar chart set up a short entry and away we go. ADX turned white and I exited the trade for a small winner.

Next, 16 tick range bar chart fires off another short signal, 3 minute chart still in a short trend, enter, move stop to break even + 1, take early exit.

Say what?

Take early exit, wait that's not in the plan, why would you do that?.

Umm, ahh, ohh, the market had been flat since the open, no follow through, I felt like it, I DON'T KNOW.

Is "take early exit" in your trading plan?

No.

How much money would you have made if you had followed your trading plan?

Why are you asking all these questions?

More importantly, who are you?

Anyway, what was the question again?

Oh, ya, how much.

Umm, ahh, ohh, $2,750.00.

How much money did you make with your "take early exit" moron trade?

Umm, ahh, ohh, $160,00.

What did we learn today?

Trade the Plan, Moron.

3 minute crude oil entry points. (click on charts to view)


16 tick crude oil range bar entry points.


Exits are when the ADX turns white, usually the open of the second white bar.

However I don't want to talk about that right now.

Yikes

NYU Professor Nouriel Roubini gives a rather bleak outlook for the good old USA in this Barron's interview.

Click on the post title (Yikes) for the video interview.

If you don't believe Professor Roubini watch this Colbert Report for the whole truth.
Click on the read more icon for the Colbert video.


read more | digg story

8/03/2008

Atlas Shrugged

Finally read Atlas Shrugged, by Ayn Rand while I was on holidays. You see it listed as a must read in many business and investing books so I thought I should read it.

It did not disappoint. It is one of those books that you miss when you're done.

My only criticism is that Rand is one of those authors that feels the need to use a thousand words to describe something when ten would do the job.

If you read you learn to skim.

That said it is a great book, a wonderful case for capitalism and a dire warning for government bureaucracy that attempts to control it.

It was written in 1957 but stands today as relevant as ever.

Give it a read.

Speculators Aren’t Driving Up Oil Prices, Report Says

A little story I missed while on holidays.

The question as always remains if speculators were responsible for driving up the price of oil, who is responsible for driving down the price of oil?

It's always interesting to watch governments and people reaction to economics they don't like. Crude oil goes up in price, we don't like that so let's blame someone.
Crude oil goes down in price, we like that, so it's just normal supply and demand economics.

"A preliminary study by a federal task force concluded that the rise in oil prices over the last five years was “largely due” to rising demand for oil, rather than speculation."

Click on the read more icon for the full NY times story.


read more | digg story

8/01/2008

Trading The Trend

I am using the 3 minute chart for direction and trend identification. Today we only saw one trend that I could trade, long as shown on the first chart.

There were short moves on the range bar chart that you could have traded after that but the 3 minute didn't get there until the end of the day.

Patience is a virtue.

So I'm told.

(click on charts to view)


The daily crude oil chart seems to have found support on the 89 EMA (yellow) as it has been on it for 8 days now. It will be interesting to see if it holds or drops down to or through the 144 EMA (blue).