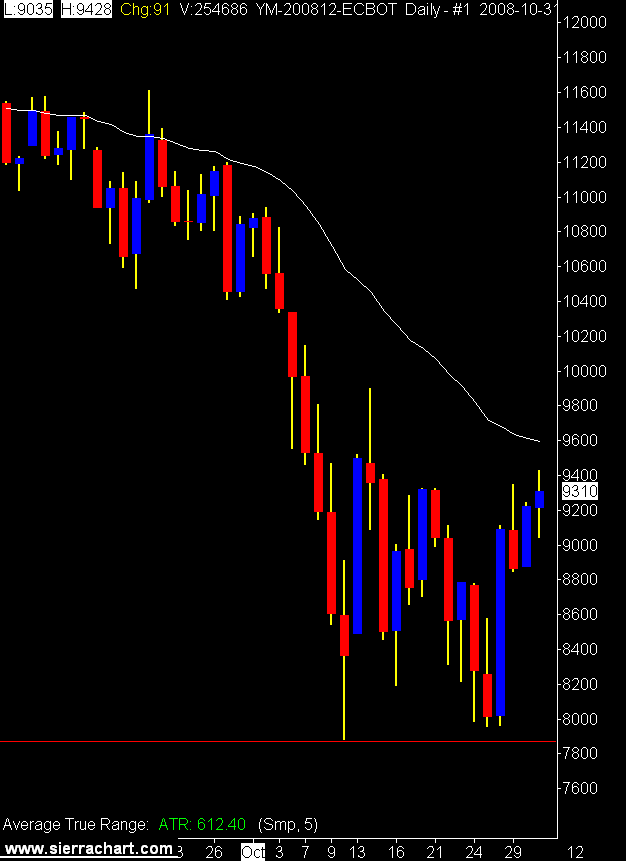
Daily Mini DOW Futures Chart
 Today's trades, 6 winners, 3 losers, and 4 break evens, for 157 winning tics / 29 losing tics = RR 5.41
Weekly totals
Total Trades 42
Win 40%
Lose 31%
BE 29%
Gross RR 3.16
The key was stopping yesterday after I hit my daily stop. Kept the lid on a bad day and allowed the week to work out fine.
2 comments:
Am I correct that you are now using a 10 point stop and a 30 point target for these YM stats?
No, 10 tic stop, 25 tic target.
I move the full stop and the be sometimes. That and slippage effect the numbers.
Today’s winners were, 27, 26, 25, 25, 25, and 25. Losers 9, 10, 10, and bes 5, 0, 0, -1.
Sometimes you get good slippage.
Post a Comment